Enterprise AI Spend Hit $177B and Coding Agents Are a $34B Market: What Menlo's 2026 Numbers Mean for Operators
Menlo's 2026 State of Enterprise AI report puts deployment spend at $176.8B, coding at $34B, Claude Code and Codex at $24B, and average spend at 2.5x budget.
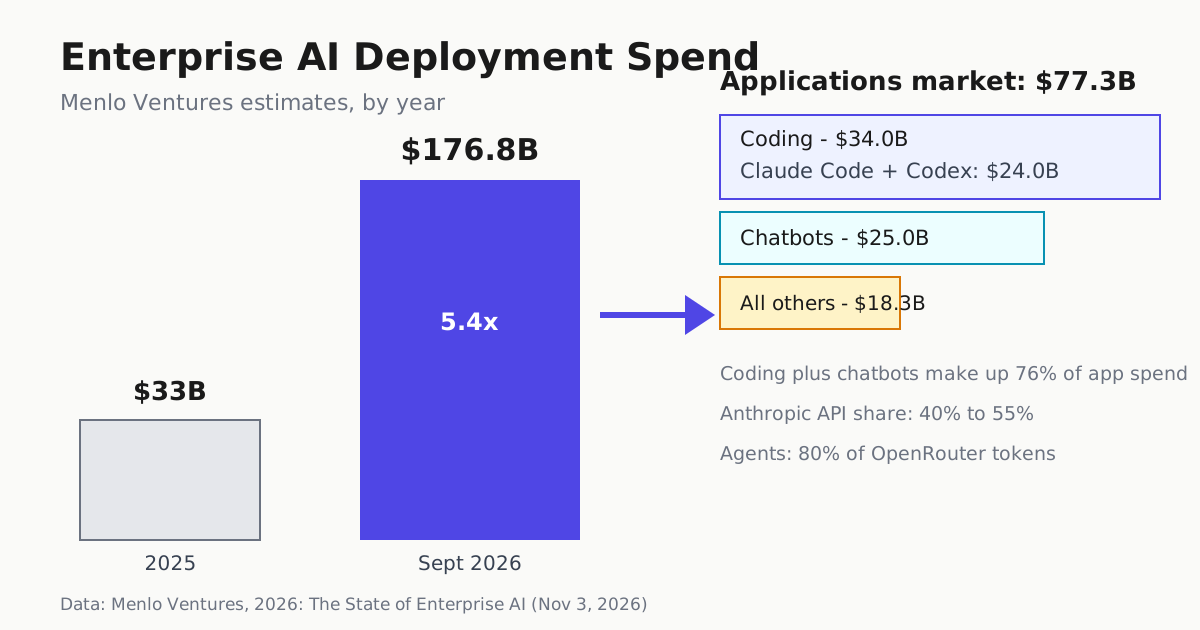
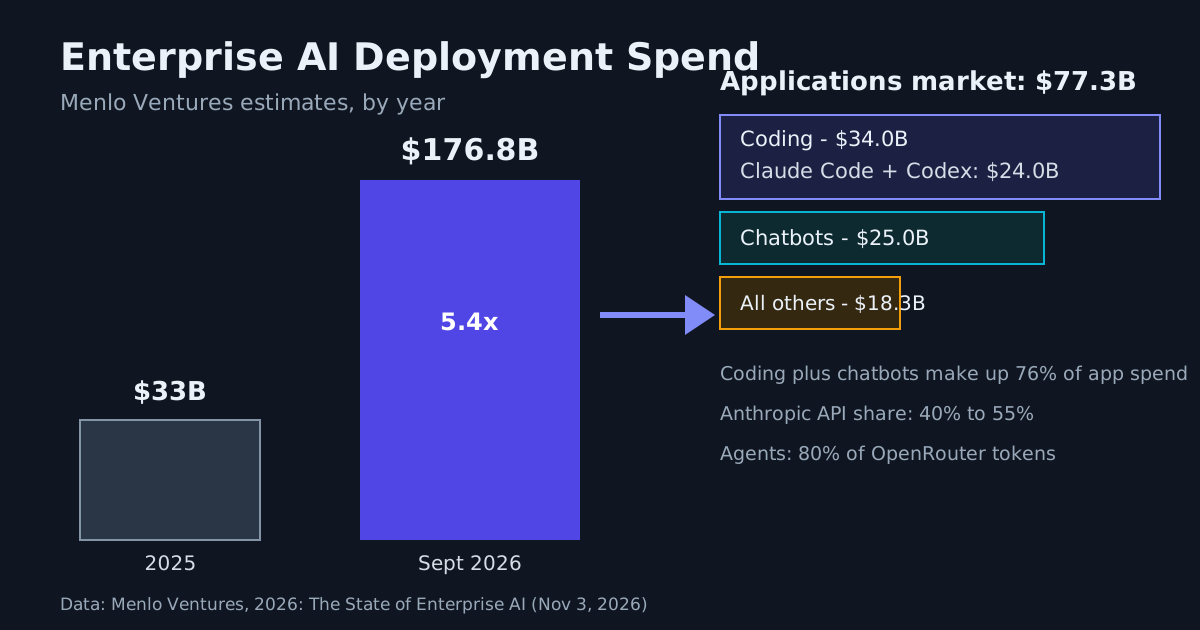
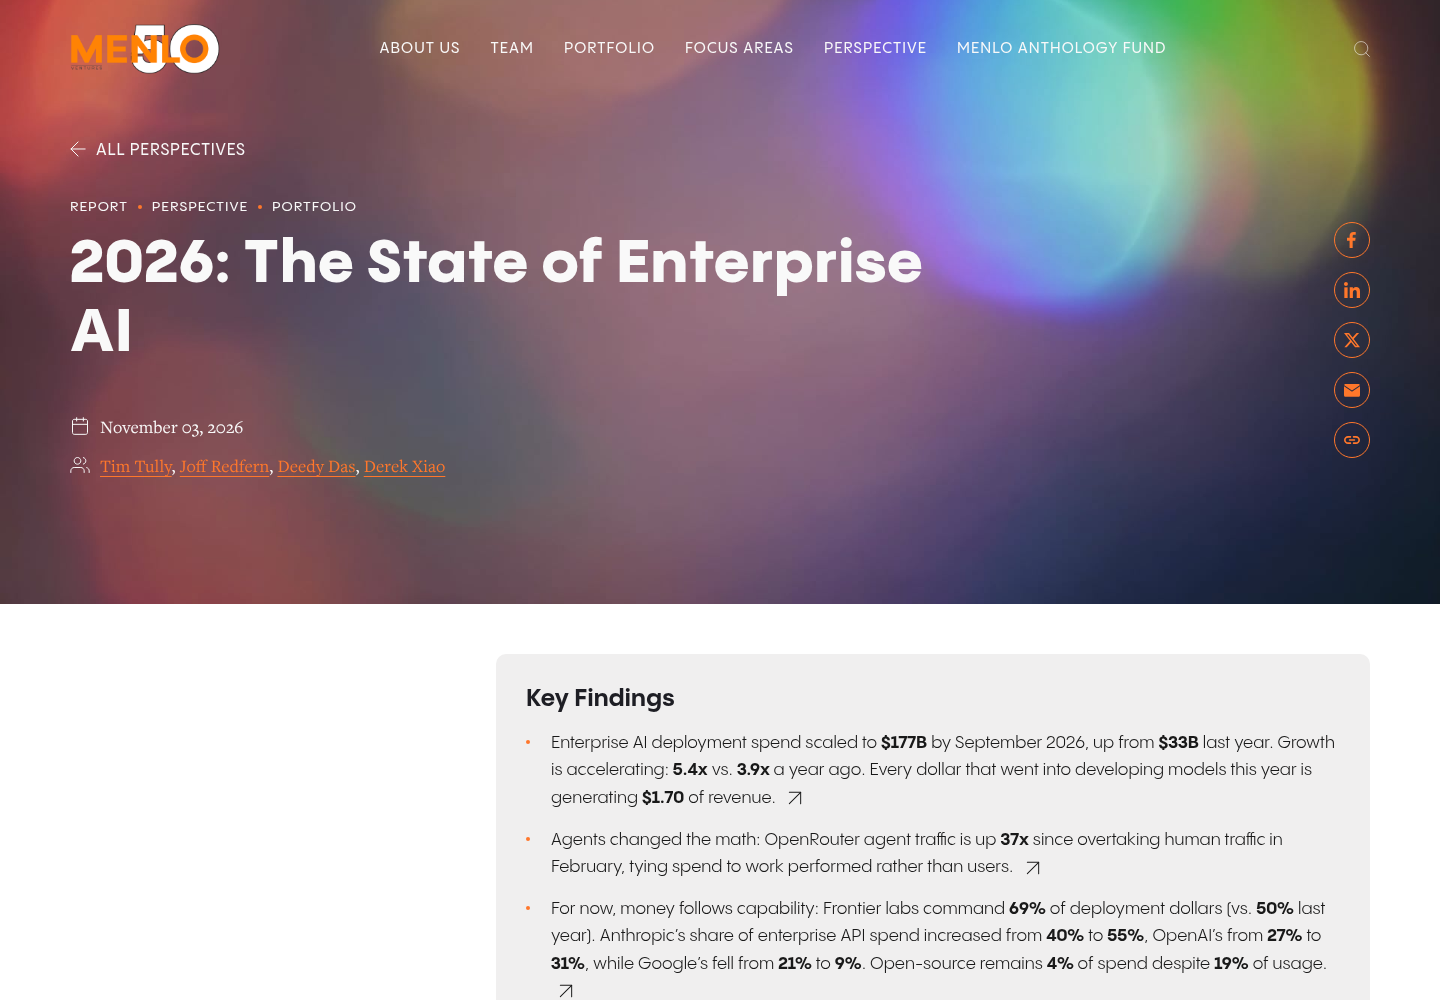
Menlo Ventures published its fourth annual State of Enterprise AI report on November 3, 2026, and the headline number is blunt: enterprises spent an estimated $176.8 billion deploying AI by September 2026, up 5.4x from $33 billion a year earlier. For teams running coding agents, the more useful numbers are further down: coding is now the single largest AI application category at $34.0 billion, and Anthropic’s Claude Code plus OpenAI’s Codex alone account for $24.0 billion — 70% of that market, up from about $1 billion last year.
The report draws on a Morning Consult survey of nearly 400 U.S. enterprise decision-makers (fielded September 8–26, 2026) plus a bottoms-up market model informed by public filings and third-party data. One disclosure worth holding in mind while reading the model-share figures: Menlo is an Anthropic investor, and several companies named (Anthropic, OpenRouter, Factory, Fireworks, Modal) are portfolio companies marked with asterisks in the report.
The operator-relevant numbers
| Metric | 2026 | Year ago |
|---|---|---|
| Enterprise AI deployment spend | $176.8B | $33B |
| Coding application market | $34.0B (up 7.7x) | ~$4.4B |
| Claude Code + Codex | $24.0B | ~$1B |
| Anthropic share of enterprise API spend | 55% | 40% |
| OpenAI share | 31% | 27% |
| Google share | 9% | 21% |
Anthropic and OpenAI together now capture 86% of enterprise LLM API spend. Menlo attributes Anthropic’s lead to Opus-class models excelling at long-horizon and coding tasks — consistent with what coding-agent operators see in their own routing. Google’s fall from 21% to 9% is the sharpest move; Menlo says Gemini 3 Pro reached the frontier in November 2025 but the lab has not matched flagship rivals since, and its API spend now skews toward cheaper Flash models.
Why budgets blew past plan — and what to do about it
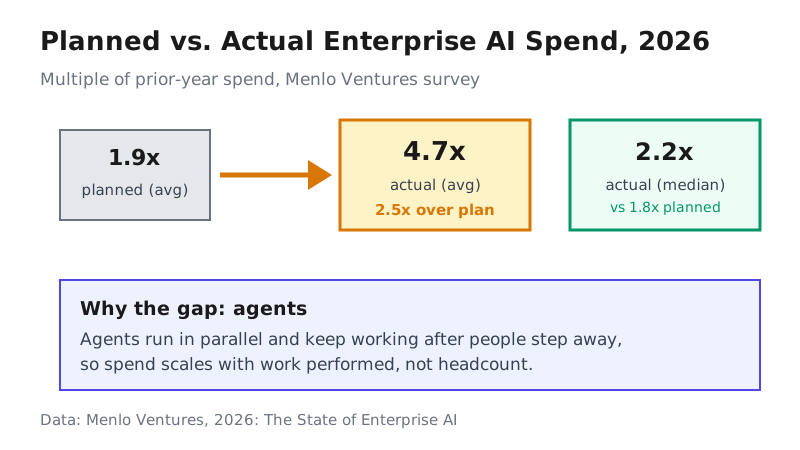
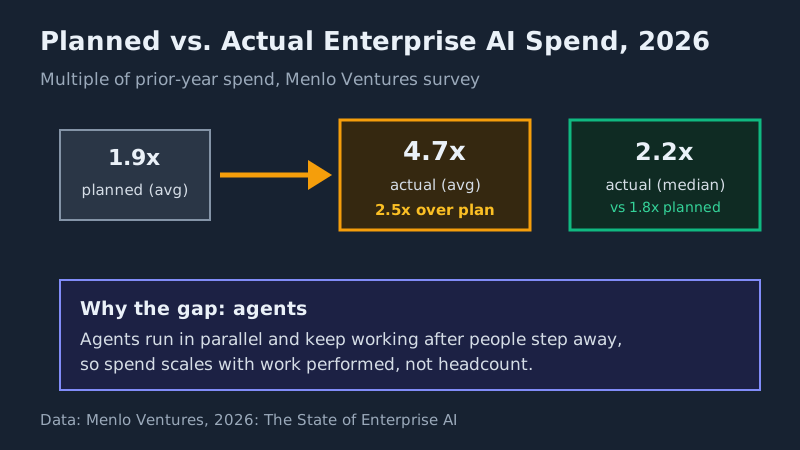
The report’s most actionable finding for anyone who owns an AI budget: enterprises planned to spend about 1.9x last year’s level and actually spent 4.7x on average (median: 2.2x actual vs 1.8x planned). Menlo attributes the gap directly to agents — they run in parallel and keep working after people step away, so spend scales with work performed, not headcount. Adoption only rose from 55% to 65%; spend per enterprise nearly quintupled.
If your 2027 budget assumes linear growth from this year’s bill, this is the data to argue with. The fat-head pattern (a small group of power users dominating spend) means a fleet-wide average will understate what your heaviest agent lanes cost. A practical response is per-lane cost ceilings and anomaly alerts keyed to the median, not the mean — cost per completed task is a better unit than dollars per million tokens when agents set their own pace.
The counter-signal arrived the day after the report: TechCrunch reports that Apple cut its engineering teams’ daily AI spending cap from $300 to $200 in October, with some allowances reportedly falling to $100 — and as low as $25 outside engineering. Rationing at that granularity suggests at least one very large operator concluded uncapped internal agent usage does not pay for itself. Both things can be true: aggregate spend is exploding, and individual shops are discovering their marginal agent-hour can be negative.
Agents now consume the tokens
On OpenRouter, agents generate 80% of all tokens — about 130.9 trillion per week, roughly 7x human-driven usage. Agent traffic overtook human traffic in early February 2026 and has grown 37x since. Menlo caveats this correctly: OpenRouter is one channel that skews toward individual developers and startups, not the enterprise buyers in its survey.
The pricing consequence is worth internalizing. Cache reads can make up 95%+ of an agent’s tokens; at Opus 5.5’s $0.20 per million for cache reads versus $4 fresh input and $20 output, Menlo models a typical agent session at about $0.70 per million blended tokens. As agents become a larger share of usage, average price per token falls — your bill grows with work performed even as unit prices drop.
Open source: usage up, spend flat
Open-source models now handle 19% of tokens but only 4% of model spend, with average open-source token prices down 3.3x to $0.13 per million. Chinese models dominate open-source spend at 89% (Kimi 61%, DeepSeek 15%, GLM 11%). Independent analyst Nathan Lambert, who tracks the open-model economy, cautions that all open-model adoption measurements remain imprecise — noisy platform metrics and marketing numbers — while noting concrete signals like Fireworks disclosing it now serves 40T+ tokens per day of customized-model inference. Menlo’s spend-share figure and Lambert’s skepticism are compatible: enormous token volume at collapsing prices.
For routing decisions, the report’s tier data matters: buyers traded up, not down. The most popular models moved from Claude Sonnet 4.5 ($3/$15 per million tokens) and GPT-5 ($1.25/$10) to Claude Opus 5.5 ($4/$20) and GPT-6 Astra ($10/$60). Meanwhile the price war is confined to small models — cut 80%+ — yet small closed models still lost token share to open source. Vercel’s own gateway index tells a similar open-weight story.
Why coding wins
Menlo’s explanation for why coding and chatbots take 76% of the $77.3B application market is a usable checklist for picking your next agent deployment: environments agents can act in, complete context they can learn from, and results they can verify. Compilers and tests make coding uniquely verifiable — which is why AI-native providers hold 96% of the category. Categories lacking those properties grew slower: HR 2.5x to $0.9B, marketing 1.8x to $1.2B, versus customer success at 4.3x to $2.7B where playbooks and resolutions define success.
The takeaway for operators is to treat verifiability as a precondition, not a nice-to-have: if you cannot automatically check the agent’s output, expect the economics of the slow categories rather than the fast one.