 Automater
AI Agent Cost Alerts: Anomaly Thresholds, Paging, and Auto-Pause for Agent Fleets
AI agent cost alerts for fleets: baseline two weeks, define a 3x-day anomaly plus velocity and worker triggers, page with the right facts, pause spawns first.

Go deeper. Build your own.
Suppose a coordinator subscribed to your CI picks up a flaky-test failure at 11:20 on a Thursday night and spends three days of the fleet’s normal budget by midnight. Nobody was paged, because nothing knew what normal was. The invoice knows, in about three weeks. AI agent cost alerts exist to close that gap to about five minutes, and the parts are boring on purpose: a meter, a baseline, four threshold definitions, one alert path, and a pause policy that stops new spawns before it touches anything mid-write.
That is the Tuesday deliverable: a two-week baseline procedure running, a written definition of “anomaly” your team agreed to, a page that carries enough to act on, and an auto-pause you have tested on a fleet with nothing at stake.
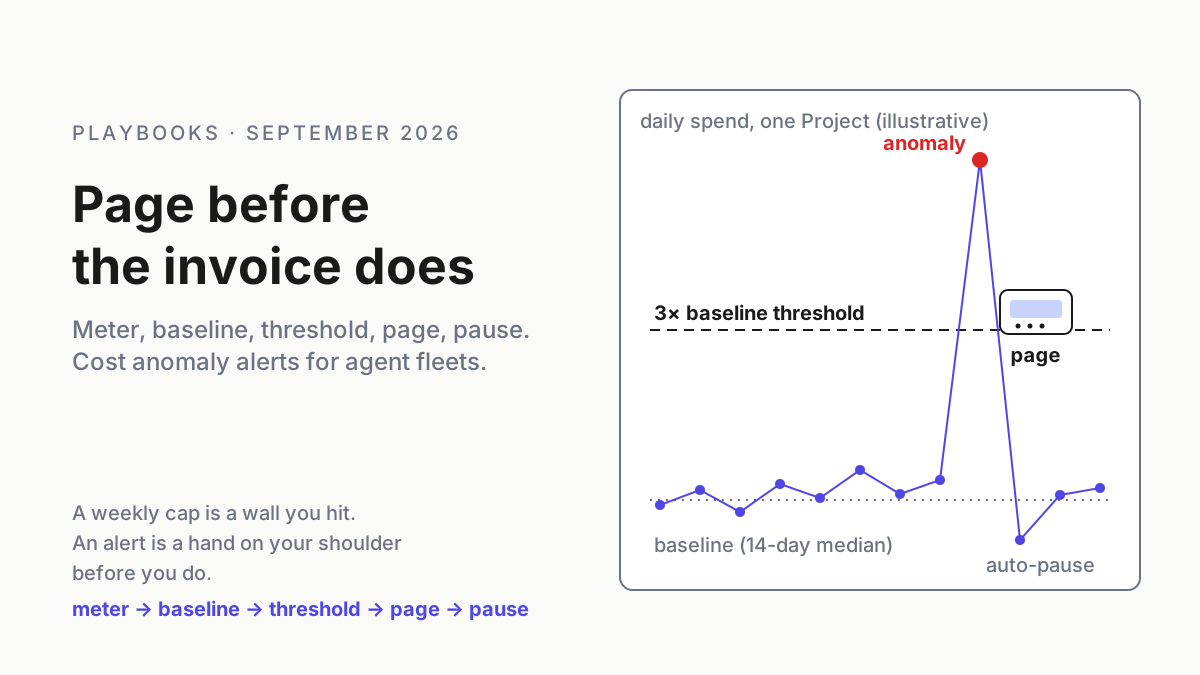
It is a fleet problem rather than a plan problem because agents act, and coordinators act by spawning more agents, so spend moves at machine speed through trees you did not draw. A weekly cap is a wall you hit. An alert is a hand on your shoulder before you do.
Sep 10: managed harnesses put three meters on one worker
On Sep 10, 2026, OpenAI moved the Agents API to public beta: “Build and run cloud agents with the Codex harness, fully managed by OpenAI,” with OpenAI handling “sessions, orchestration, context compaction, and recovery,” and subagents on the feature list. The docs overview states the billing in one sentence: “Model usage is billed at the selected model’s API rates, OpenAI tools use the standard rates, and OpenAI-hosted sandboxes use standard container rates.”
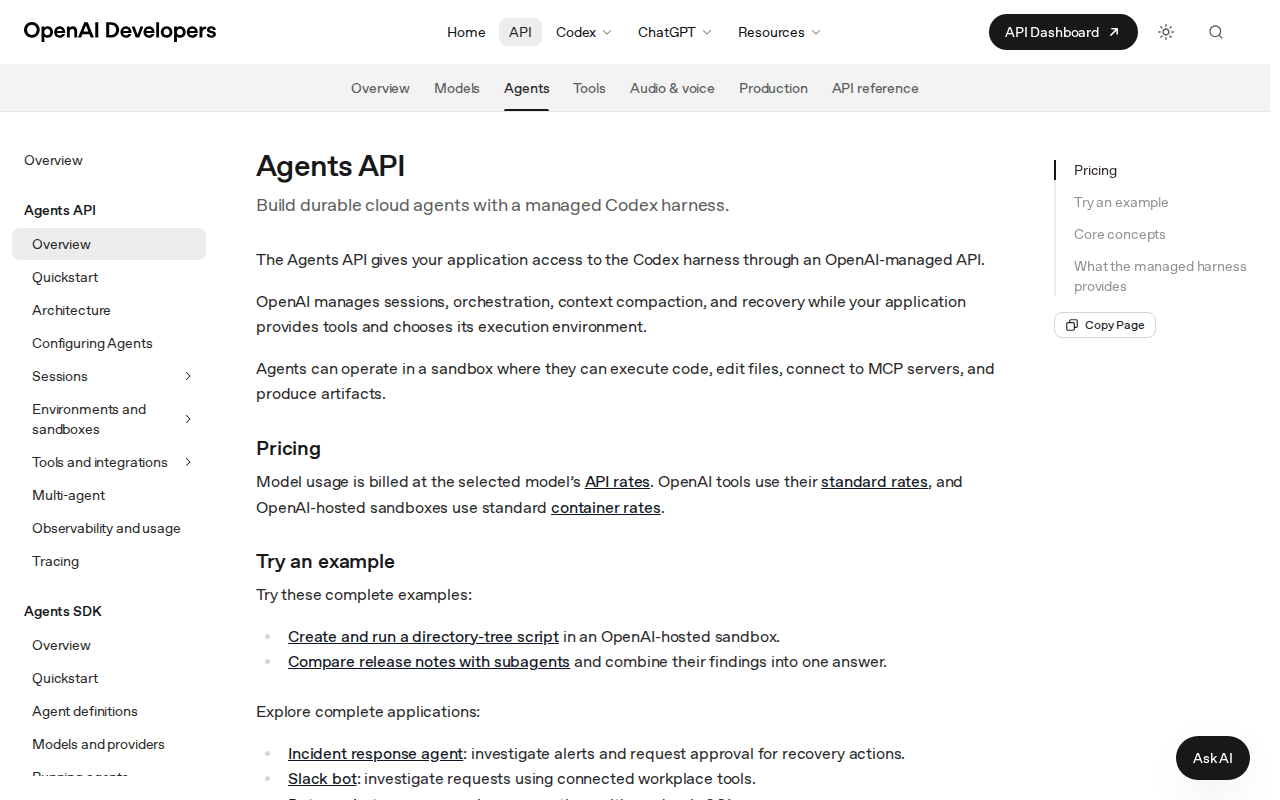 Screenshot: OpenAI Developers, “Agents API” docs overview (Sep 10, 2026), captured Sep 13, 2026.
Read that sentence as an operator. One worker now has three meters running at three rates, and only the first looks like the token counts your CLIs report locally. Container time accrues while a worker waits on a test suite; tool rates accrue on calls you did not enumerate. InfoWorld’s Sep 11, 2026 coverage made the strategic point: when one vendor provides “the model, context management, tools, orchestration, and execution environment,” that dependency “could also weaken an enterprise’s negotiating position on pricing and terms.” The operational point is smaller and arrives sooner. You cannot alert on a line you cannot see until the invoice.
The same day, Cursor’s Projects launched with a coordinator “running as many in parallel as the work needs,” on the Aug 19, 2026 foundation of subagents that each get “an isolated copy of the project with clean context in its own cloud environment” (changelog). Metering that fan-out is its own runbook. This piece assumes the meter exists and asks what should happen when its number is wrong.
Why AI agent cost alerts need a fleet meter, not a vendor view
Each vendor’s usage view is scoped to its own accounting domain. A desk running Claude Code, Codex, and a coordinator therefore gets partial totals that still need reconciliation, and session rows do not necessarily preserve the parent-child tree behind a fan-out. The vendor view remains useful; it just cannot be the fleet’s only ledger.
An alert needs a number that is fleet-wide, per Project, per worker, and current to the minute. That is a local meter’s job: read what supported CLIs on the machine write to disk, attribute it by host, harness, Project, and spawn, and keep a running total you own. Automater Lite provides local usage and token meters across its supported providers and transcript formats, with downloads for Windows x64, Apple-silicon macOS, and Linux x86_64 (automater.ai). It reports; it does not enforce a budget, pause a coordinator, or see a managed harness’s container-time line, which live in your policy layer and on the vendor’s invoice respectively. Pro’s diagnostics earn their place when the anomaly turns out to be a runtime that is looping rather than a prompt that is wrong. The procedure below does not care which local meter feeds it.
Step 1: Baseline for two weeks before you set a single threshold
A threshold set on day one is a guess wearing a number. Run the meter for fourteen days and record, per day, the fields below. Do not alert during the baseline window except on one hard ceiling: a fleet-per-day maximum you are certain is wrong if crossed.
| Record daily | Split by | Why |
|---|---|---|
| Spend (USD, plus tokens in and out) | fleet · host · harness · Project · worker role | The baseline is per key, not per fleet; one Project’s normal is another’s anomaly |
| Peak spend velocity (USD per hour) | fleet · Project | Velocity alerts fire hours before daily totals do |
| Peak concurrent workers | Project | Fan-out spikes precede spend spikes |
| PRs merged, and spend per merged PR | Project | The productivity denominator; drift here is the slow leak |
| Weekday or weekend | all | Weekend baselines run lower; a weekday threshold on a Saturday never fires |
Use the median and the median absolute deviation rather than the mean; one bad day in week one would otherwise become the baseline. At the end of week two you have, per Project, a median daily spend, a median peak velocity, a p95 concurrent worker count, and a median cost per merged PR. Those four numbers are the whole baseline, and the operating bill is what you pay to have them without doing it by hand.
Keep the baseline rolling after that: a 14-day window that excludes any day flagged as an anomaly. A baseline that ingests its own anomalies stops detecting them.
Step 2: Define anomaly in four ways, and write all four down
One threshold is a smoke alarm; four is a fire panel. Each catches a failure the others miss.
| Anomaly | Trigger (illustrative defaults) | Window | What it catches |
|---|---|---|---|
| 3× baseline day | Day’s spend ≥ 3 × median daily spend for that Project (or fleet) | Rolling day, evaluated every 5 min | The runaway that grew all day |
| Spend velocity | Any hour ≥ 25% of median daily spend, or ≥ 3 × median peak hour | Trailing 60 min | The fan-out that commits the day’s budget in fifteen minutes |
| Worker count spike | Concurrent workers ≥ 2 × p95, or any spawn past the configured cap | Instant | Slack subscription storms; a coordinator that misread scope |
| Cost per merged PR drift | Trailing 7-day cost per merged PR ≥ 2 × baseline | Weekly, reviewed daily | Thrash: spend flat, output falling |
The 3× multiplier is a starting point, and the right one for a fleet with real variance; at 2× you page on every busy Tuesday and stop reading the pages by Friday. The velocity rule is the one most desks skip and the one that would have caught the Thursday night in the opening. A CI-triggered fix loop that retries eleven times looks fine at the daily level until it does not; CI fix loops that don’t thrash is the upstream guard, and cost-per-merged-PR drift is the downstream signal that the guard failed.
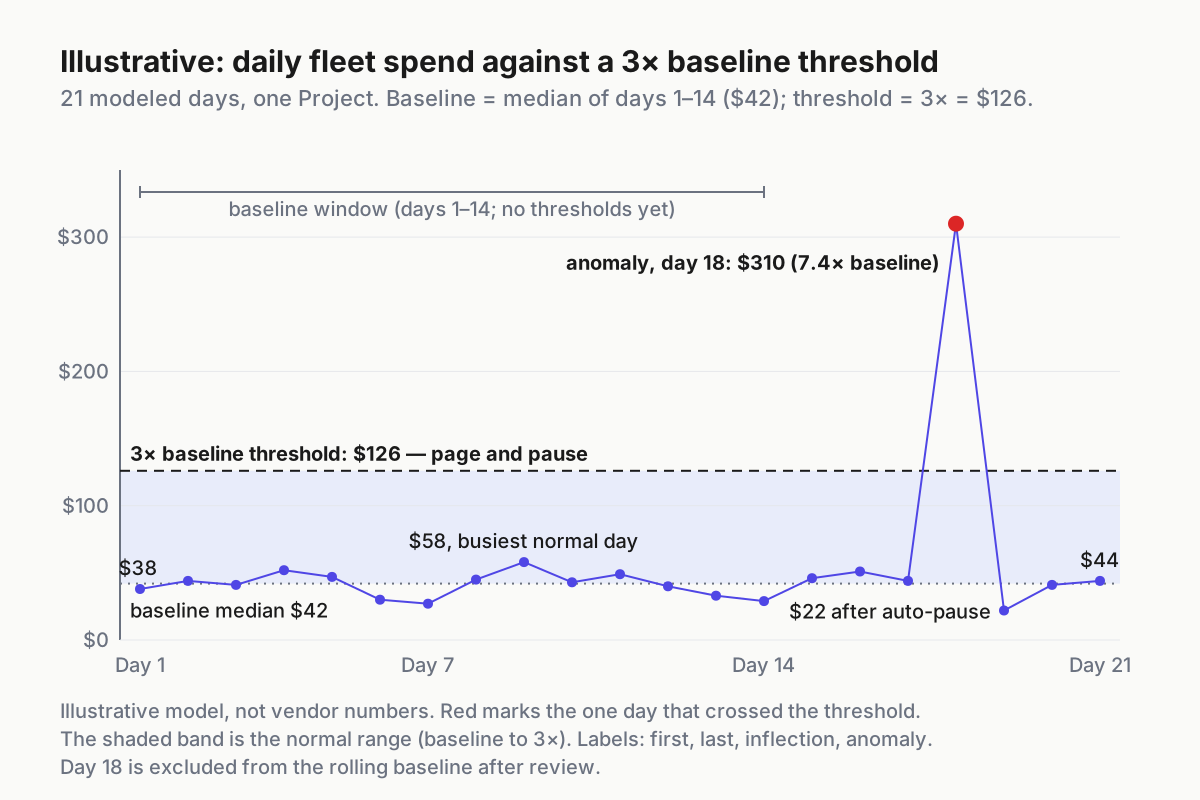 Illustrative. Fourteen quiet days set the median; the threshold is 3× that; day 18 is the page. Day 19 is what auto-pause looks like.
Write the four definitions in the policy file the coordinator reads but cannot edit. Writing them down serves the person paged at 11:20 p.m., who needs to read why, more than it serves the machine.
# cost-alerts.yaml (illustrative shape); evaluated by the alert loop, enforced by the spawn wrapper
project: billing-migration
baseline:
  window_days: 14
  stat: median # never mean
  exclude_flagged_days: true
  split_weekends: true
anomaly:
  daily_multiple: 3.0
  hourly_share_of_daily: 0.25
  worker_multiple_of_p95: 2.0
  cost_per_merged_pr_multiple: 2.0
on_anomaly:
  - pause_new_spawns
  - hold_writes # no commit, push, merge, deploy
  - page: fleet-oncall
  - require_human_resume: true
Step 3: Build the alert path, and decide what the page must carry
The path is short: meter → baseline → threshold → page → auto-pause → review. It usually breaks at the page (sent to a channel nobody watches at night) or the review (never scheduled, so the same anomaly fires next week).
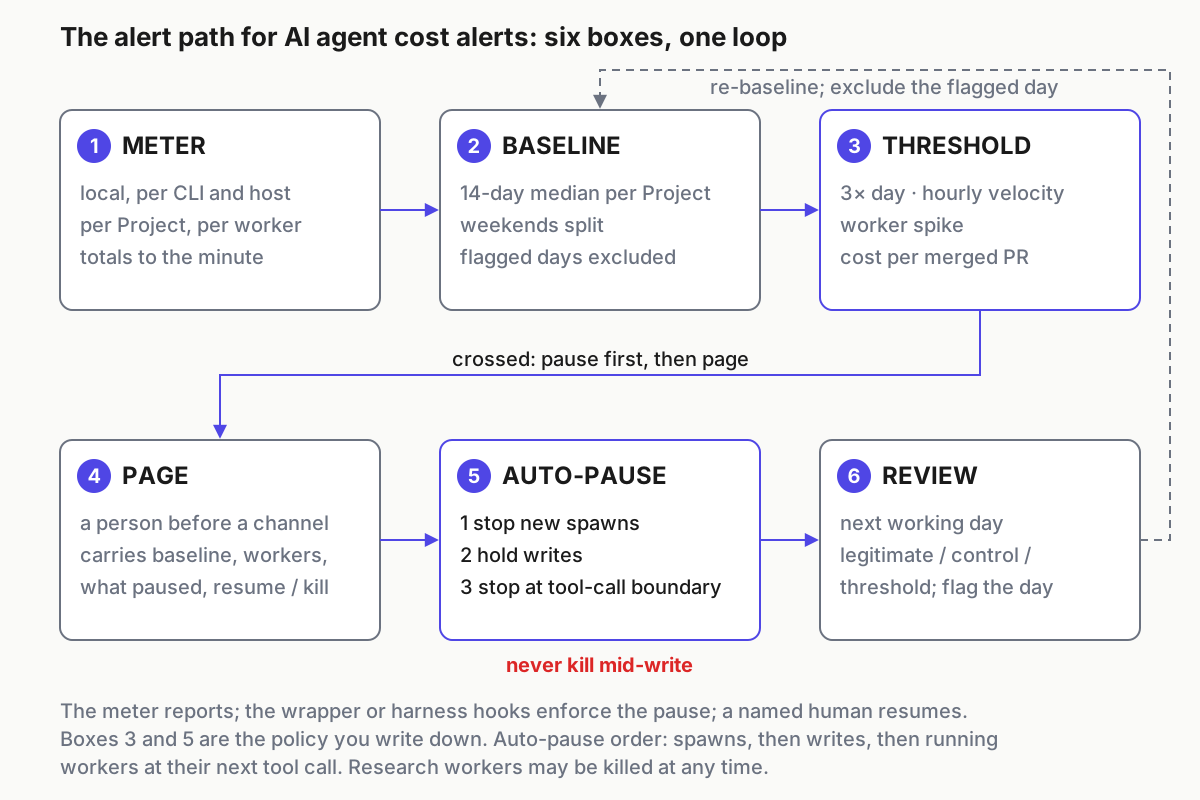 Six boxes. The loop from review back to baseline is the part that keeps the panel honest.
Who gets paged, in order: the Project’s owner (the human who raised its budget last), then the fleet on-call, then whoever can revoke the coordinator’s credentials. Page a person before a channel; the channel is where the page is also posted, for the record. I have never regretted paging a person first. The message must carry enough that the recipient can act on it without opening anything else:
COST ANOMALY  billing-migration  (velocity)
now:       $118 in last 60 min   (baseline peak hour: $9;  daily median: $42)
today:     $187 so far   (3x threshold: $126)   workers: 14 running (cap 8, p95 6)
harness:   cursor-projects coordinator coord-billing-07   host: cloud-vm-2
paused:    new spawns HELD, writes HELD; 14 workers finishing current tool call
top spend: w-0417 write $19.40 · w-0402 write $17.90 · w-0388 research $6.10
ledger:    ~/.fleet/spawns.jsonl (last 30 lines attached)
resume:    fleet resume billing-migration --budget +60 --by <name>
kill:      fleet kill-task t-migrate-invoices --at tool-call-boundary
Every line is there for a reason. The baseline figures let the reader judge severity without a dashboard; the worker line says whether the cap held; the paused line says what the system already did, so nobody does it twice. The resume and kill lines are the only two decisions available at 11:20 p.m., and both carry a name.
Step 4: Auto-pause policy, in the only safe order
Automatic action on a cost alert is where operators get nervous, and rightly, because the wrong automatic action costs more than the tokens. The order below never makes it worse.
- Stop new spawns. Cheapest action, largest effect. The coordinator keeps running; it just cannot grow. Queue the spawns and let the coordinator see the queue.
- Hold consequential writes. No commit, push, merge, or deploy from any worker until a human resumes. Edits in the working tree may finish.
- Let running workers reach their next tool-call boundary, then stop them there. Never kill mid-write. A half-applied migration or a half-written file is a cleanup task you will pay a worker to do tomorrow.
- Page, with the message above, after steps one through three have taken effect, so the message reports what happened rather than what will.
- Require a named human to resume. Resuming means raising the budget with a name attached, or killing the task. There is no third option and no timeout that resumes on its own.
Two exceptions. Research workers can be killed immediately at any threshold; they hold nothing. And a worker-count anomaly with no spend anomaly (the fan-out just happened) gets step one only, with an informational page, because the cap held and the system is doing its job.
The pause is enforced by your coordinator’s configuration, your wrapper around spawn, or the harness’s own hooks, never by the meter and never by a prompt. Cursor’s Aug 19 note that follow-ups “wait for the next tool call instead of cutting the agent off mid-action” is the boundary you want every harness to honor; where one does not, the wrapper has to. Nothing in the tray does this for you. It reports.
Step 5: Review within a day, then re-baseline
Every fired alert gets a fifteen-minute review the next working day, with three questions: was the spend legitimate (scope grew, the work was worth it), a control failure (cap did not hold, a subscription storm, a loop), or a threshold failure (busy day, bad baseline). Legitimate spend raises the Project’s baseline by hand. Control failures get a fix in the policy file. Threshold failures adjust the multiplier once, in writing, so nobody adjusts it again next month by feel.
Then flag the day in the ledger so the rolling baseline excludes it. That one field keeps a fleet’s idea of normal from drifting up one anomaly at a time.
AI agent cost alerts that break, and how you’ll know
Poisoned baseline. An anomaly in week one became the median. Signal: thresholds that never fire while spend has visibly doubled. Fix: exclude flagged days and re-run the window.
Weekend silence, Monday shock. One threshold for all seven days. Signal: every Monday looks like an anomaly and no Saturday ever does. Fix: split the baseline.
The line you cannot see. Container time and tool rates on a managed harness that only show on the invoice. Signal: the invoice exceeds the sum of your meter’s totals by a stable percentage. Fix: treat the gap as a known factor, alert on the tokens you can see, and pull the vendor’s usage export on a schedule; evidence when the harness is vendor-hosted covers what to export and when.
The page nobody read. Alerts routed to a channel with two hundred members and no on-call. Signal: median time from fire to human action measured in hours. Fix: page a person; post to the channel second.
The pause that killed mid-write. Auto-pause implemented as a process kill. Signal: workers resuming into merge conflicts and half-applied changes. Fix: reorder to the sequence in step four.
The fleet outgrew the threshold. Head count doubled; the baseline did not. Signal: a page every day, all legitimate. Fix: baseline per Project rather than per fleet, and re-baseline on any deliberate scale change.
Stall mistaken for savings. Spend drops because a coordinator hung rather than finished. Signal: spend well under baseline with tasks still open. This is the one alert that fires low, and it is why stall flags and cost alerts belong on the same panel.
The panel is operating-layer infrastructure, not a smarter prompt
A coordinator told to watch the budget will watch it until the work argues otherwise. The meter, the baseline, the thresholds, the pager, and the pause are the operating layer of a fleet: they sit outside every model, read what every harness writes, and act without asking the coordinator’s opinion. That is the shape one boss over the fleet has always argued for, and it is the part of agentic ops that no vendor’s in-product view can supply, because the view stops at the vendor’s edge and your fleet does not.
The local meter is the free half of that panel and the half most desks skip. The Lite tray gives the operator usage signals and stall flags; the thresholds, pager, and pause are yours to write, and you now have the shape of all three. Automater Lite is free on automater.ai; Pro is $50/year.
FAQ: AI agent cost alerts
What counts as a cost anomaly for an AI agent fleet?
Four things, defined against a 14-day median per Project: a day at 3× baseline spend, an hour that consumes 25% of a normal day, concurrent workers at twice the p95 or past the cap, and cost per merged PR drifting to twice its baseline. Write all four down; each catches a failure the others miss.
Should agents auto-pause when spending spikes?
Yes, in a fixed order: stop new spawns, hold commits and merges, let running workers reach their next tool-call boundary, then page. Never kill a write worker mid-action; the cleanup costs more than the tokens saved. Resume only when a named human raises the budget or kills the task.
Sources
- OpenAI Agents API docs overview — billing: model at API rates, tools at standard rates, hosted sandboxes at container rates
- OpenAI: Introducing the Agents API — public beta Sep 10, 2026
- InfoWorld: OpenAI launches managed Agents API — Sep 11, 2026; lock-in and negotiating position
- Cursor: Introducing Projects — Sep 10, 2026; “as many in parallel as the work needs”
- Cursor changelog — Aug 19, 2026: subagents in isolated cloud environments; follow-ups wait for the next tool call
- Automater — current Lite downloads, local-first usage meters, supported providers and formats, and Pro pricing