AgentOps: Running a Fleet of AI Agents Without Losing Your Mind
Agentic ops, defined by people who run agent fleets daily: the five-layer AgentOps stack, the four metrics that matter, and a starter incident runbook.

Go deeper. Build your own.
The overnight run looked fine. A coding agent picked up a flaky integration test at 11 p.m., and by 7 a.m. it had spent $400 in API tokens retrying a fix it could never land — reading the same stack trace, patching the same file, reverting, again. Nothing crashed. Every health check stayed green all night. The only alarm that fired was the invoice.
That gap has a name now. Agentic ops — also written agent ops or AgentOps — is the operational discipline of deploying, monitoring, evaluating, and governing AI agents: keeping autonomous systems observable, affordable, and safe, in production and in daily work. Teams adopted agents through 2024 and 2025. The discipline for operating them is being invented in 2026, mostly one incident at a time.
One more thing before the definitions: the term gets used for two different jobs, and this guide serves both deliberately. Most of what follows is about operating AI agents. One section is about AI agents doing operations — the “DevOps AI agent” sense. And a scale note the rest of the search results skip: if you run several coding CLIs on your own machine, this discipline already applies to you. A fleet with one operator is still a fleet.
What is AgentOps? A working definition
The definition above unpacks into four verbs, and each one is a concrete practice rather than a platitude:
- Deploy — prompts, tool configurations, and permission sets are versioned and shipped like code, so you can state exactly which agent configuration ran yesterday, and roll it back.
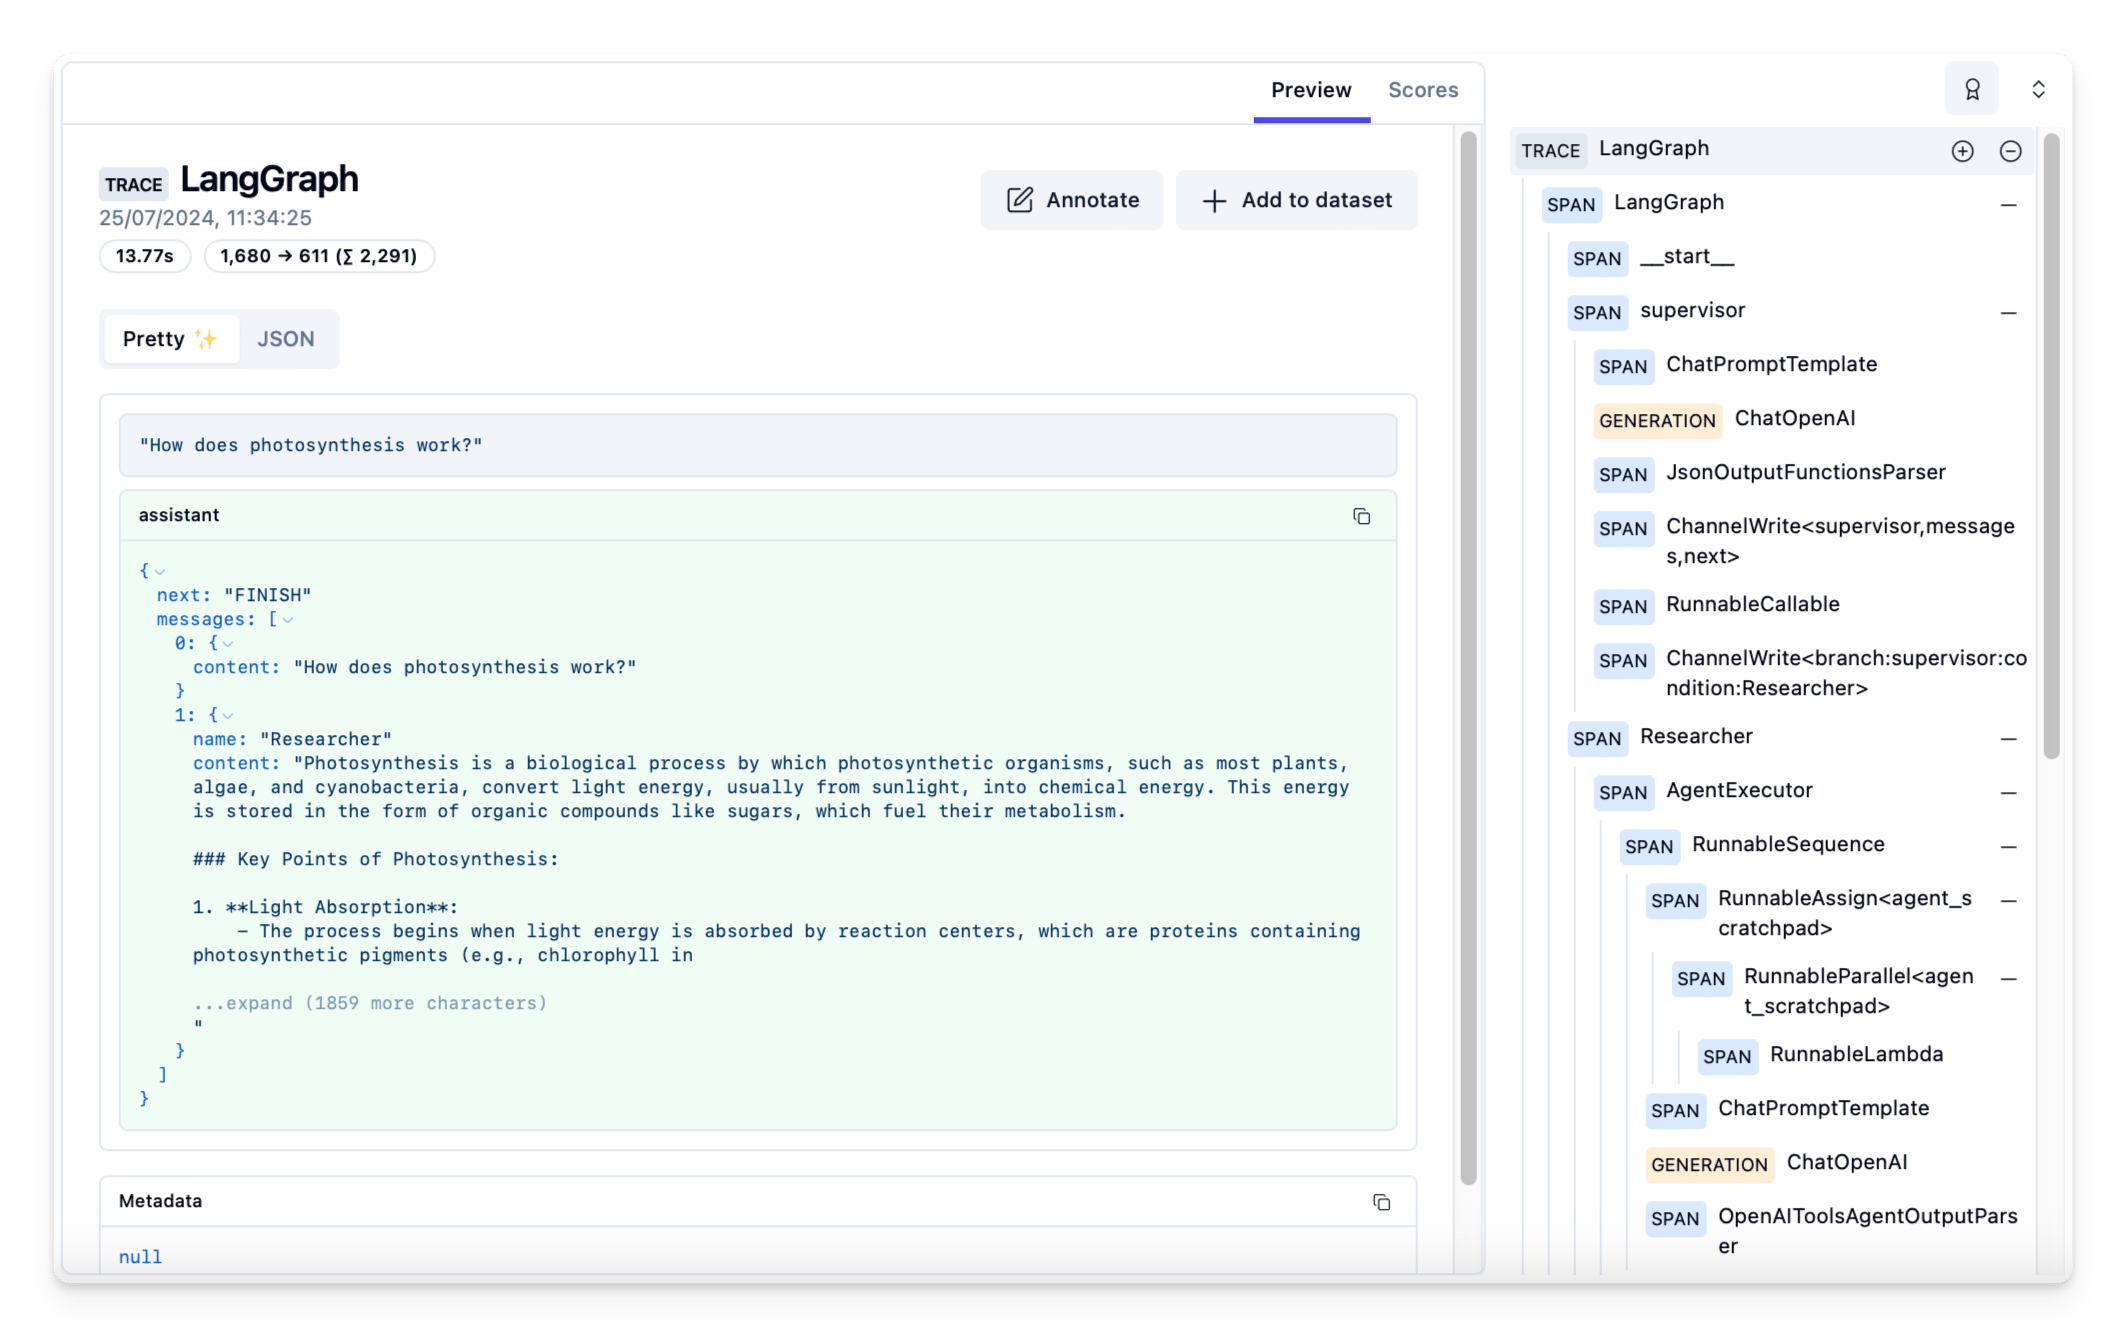
- Monitor — every run is captured as a trace of model calls and tool calls, with cost attached to each step.
- Evaluate — golden tasks run in CI to gate changes, and regression evals rerun on every model upgrade, because the model under your agent changes whether you like it or not.
- Govern — permission tiers, approval gates for irreversible actions, escalation paths, and an audit trail that survives the agent that produced it.
Positioning against the neighbors takes one sentence each. DevOps operates deterministic software. MLOps operates model artifacts. AgentOps operates autonomous behavior at runtime — the newest layer of the agentic software shift, and the least mature.
Two naming collisions, handled once: “AgentOps” is also the name of a specific agent-observability product (AgentOps.ai), which this article is not about , and “LLMOps” overlaps from the model-serving side without covering tools, permissions, or multi-step autonomy. From here on, AgentOps means the discipline.
The DevOps analogy — and exactly where it breaks
The fastest way to learn AgentOps is to port your DevOps instincts, then mark precisely where they stop working. The correspondences that hold:
| DevOps practice | AgentOps translation |
|---|---|
| CI gates on code changes | Eval gates on prompt, tool, and model changes |
| Metrics, logs, and traces | Run traces: the full tree of model and tool calls |
| Incident response and postmortems | Misbehavior runbooks, kill switches, transcript forensics |
| Infrastructure as code | Prompts, tools, and permissions as versioned code |
And the three places the analogy breaks, which is where the new work lives:
Break one: reproducibility. A deploy is deterministic; an agent run is not. The same ticket yields a different plan tomorrow, on the same model, at the same temperature. So you stop operating exact behaviors and start operating distributions — success rates, cost percentiles, outcome bands. A single bad run is an anecdote; a shifted distribution is an incident.
Break two: cost. A web request costs predictable microcents. An agent run costs $0.02 or $8 depending on how far it wanders, which makes budget a first-class operational signal — as load-bearing as latency, and spikier.
Break three: failure detection. A 200 OK wrapping a confidently wrong answer defeats every classic health check ever written. The $400 overnight loop passed all of them. Detecting semantic failure — plausible output, wrong outcome — is genuinely new work, and no uptime dashboard will do it for you.
Why the MLOps playbook doesn’t cover it either
- The MLOps frame: version the model, the dataset, and the training pipeline; monitor drift and prediction quality. It is a discipline built around artifacts, and it’s good at artifacts.
- Agents add what the artifact frame cannot see: tools, prompts, permissions, and multi-step runtime state. The unit of operation is behavior, not weights.
- A concrete regression from practice: an agent’s success rate drops by half, and the cause is not a model change but a renamed flag in a CLI tool the agent shells out to. No model registry, drift monitor, or feature store catches that. A run trace catches it in minutes.
- The mature position: reuse the MLOps muscle where it fits — eval datasets, canary thinking, versioning hygiene — and stop pretending it covers tool use and autonomy.
The AgentOps stack: five layers
Every serious operation we’ve seen converges on the same five layers, usually built in the wrong order and re-sorted after the first incident.
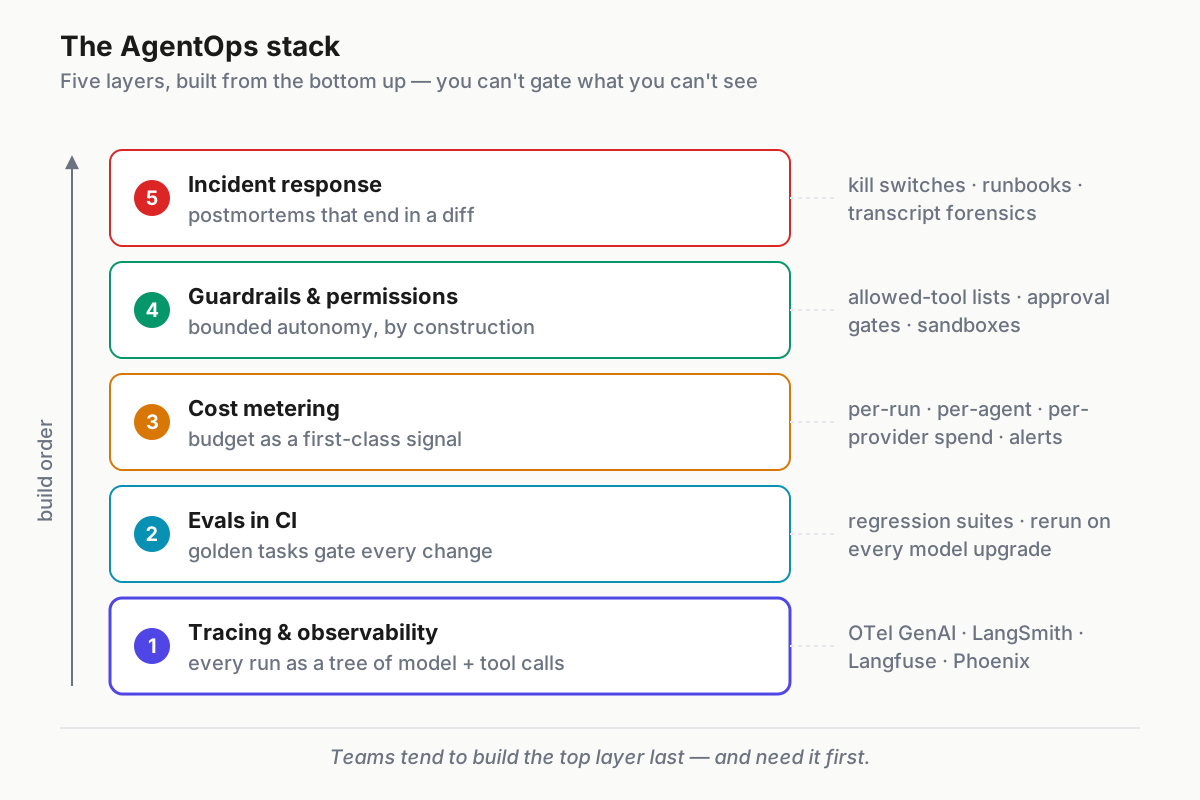
 The five layers of agentic ops. Teams tend to build the top last and need it first.
- Tracing and observability. Every run captured as a tree of model calls and tool calls, queryable later. OpenTelemetry GenAI semantic conventions give the data a vendor-neutral shape ; LangSmith, Langfuse, Braintrust, and Arize Phoenix are the tools we see deployed most.
- Evals in CI. Golden tasks gate prompt and tool changes the way tests gate code, and the suite reruns on every model upgrade. This layer is big enough to have its own guides — evals for AI agents and the reinvented test harness for agentic software.
- Cost metering. Per-run, per-agent, per-provider spend, with budgets and alerts. The layer most teams add last and regret not adding first — see break two above, and the invoice that opened this article.
- Guardrails and permissions. Allowed-tool lists, approval gates for irreversible actions, sandboxes for execution. The security half of this layer — prompt injection, least privilege — lives in securing AI agents; for tool servers specifically, the US government’s June 2026 MCP security guidance is the reference document, unpacked in our MCP hardening playbook.
- Incident response. Kill switches, credential revocation, transcript forensics, and postmortems that end in a diff. The starter runbook below is this layer’s template.
The order matters. Tracing before evals, because evals need trajectories to judge. Metering before guardrails, because budgets are the cheapest guardrail. Incident response last on the diagram and first in your calendar, because you’ll practice it whether you planned to or not.
The other AgentOps: AI agents doing DevOps
The second sense of the keyword — the DevOps AI agent, the AI agent for devops — is not a category essay; it’s three scenarios that already run in real stacks. Each follows the same shape: trigger → agent actions → human gate.
- Incident triage. Trigger: the 2 a.m. error spike. Agent: correlates the spike with the 11 p.m. deploy, assembles a timeline from logs and traces, drafts the rollback PR, and pages a human with the evidence attached. Gate: a person approves the rollback. PagerDuty and incident.io both ship AI features in roughly this shape.
- Runbook execution. Trigger: certificate expiring, queue depth climbing, disk filling. Agent: walks a permissioned runbook — restart, scale, renew — reading state as it goes. Gate: every destructive step requires approval; read-only steps don’t.
- Infra cost optimization. Trigger: a weekly schedule. Agent: hunts idle resources, flags oversized instances, rightsizes Kubernetes requests. Gate: it opens PRs; it never applies directly.
The sanity rule underneath all three: agents propose, pipelines apply. Agent-generated changes flow through the same PR-and-CI path as human changes — same reviews, same gates, same audit trail. How that path absorbs machine committers is its own topic: agentic CI/CD.
Agentic ops vs non-agentic operations
The “non agentic” query deserves a straight answer, because the distinction is load-bearing for everything above.
| Non-agentic operations | Agentic operations | |
|---|---|---|
| Execution | Fixed, deterministic, pre-scripted | Goal-driven, tool-choosing, variable-path |
| Examples | cron, CI jobs, Ansible playbooks, Zapier flows | Triage agents, coding CLI sessions, research runs |
| Same input twice | Same behavior twice | Possibly different plan each time |
| Typical failure | Breaks loudly and stops | Wanders confidently and continues |
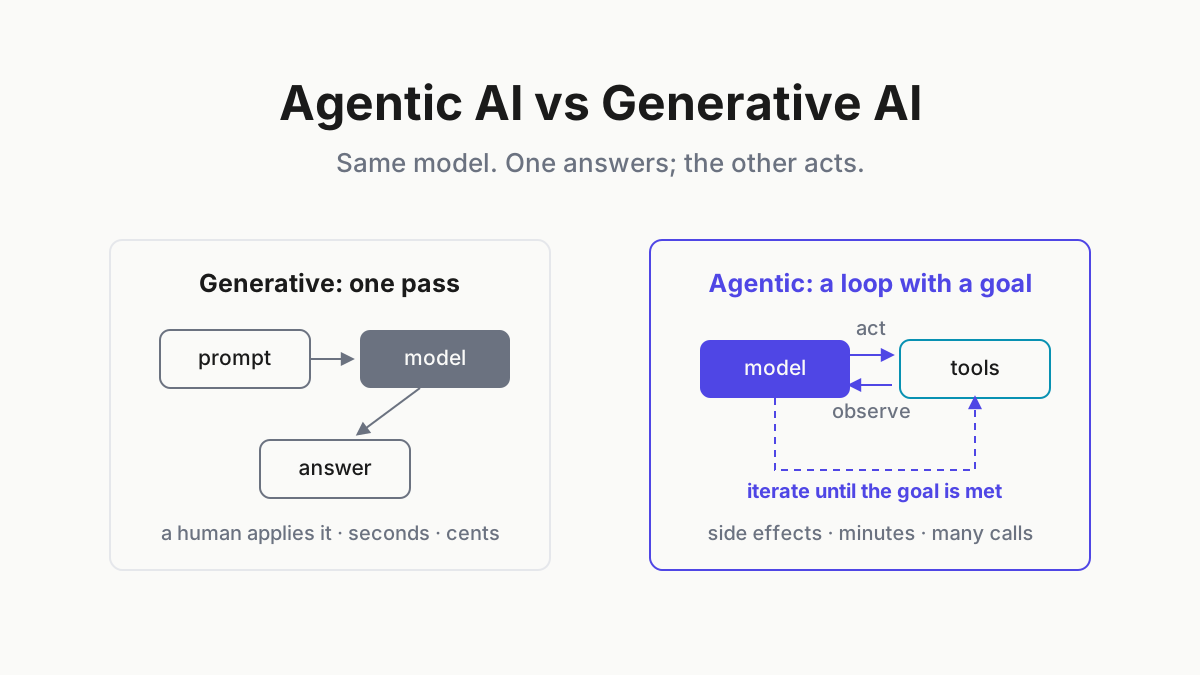
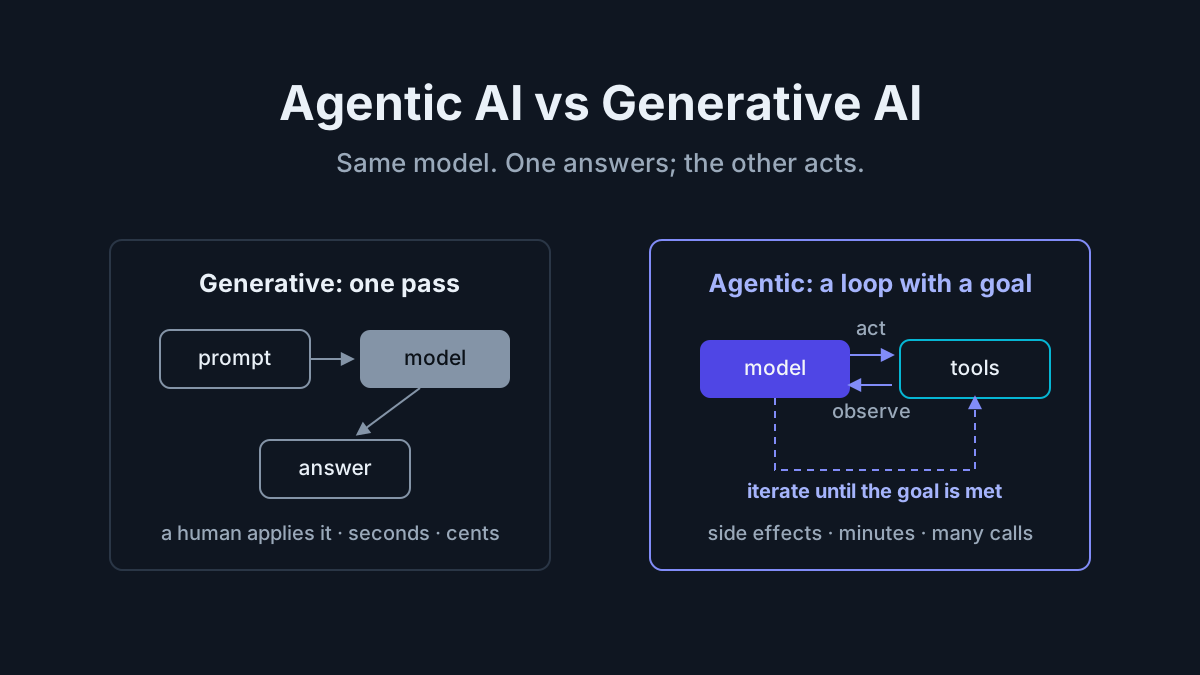
The distinguishing test fits in one question: does the system decide how at runtime? A pipeline retries the same way every time it fails. An agent invents a workaround — which is precisely its value and its risk.
Two things follow, and the first is a defense of the boring option. Non-agentic is correct wherever judgment adds risk instead of value: deploys, backups, migrations, anything where you want Tuesday’s run identical to Monday’s. Nobody wants a creative backup script.
The second is the mature hybrid most production setups land on: agentic diagnosis, non-agentic execution. The agent investigates, decides which of your boring, tested scripts fits the situation, and invokes it through the normal gate. Judgment where it helps, determinism where it counts.
Personal-scale agentic ops: you already run a fleet
Here’s the version of this discipline nobody writes down. A developer with Claude Code in two worktrees, Codex CLI on a refactor, and OpenCode pinned to a local model is running a distributed system — three autonomous processes, shared repos, one scheduler. The scheduler is you, and you are the least reliable component: single-threaded, distractible, and prone to forgetting which terminal asked for what.
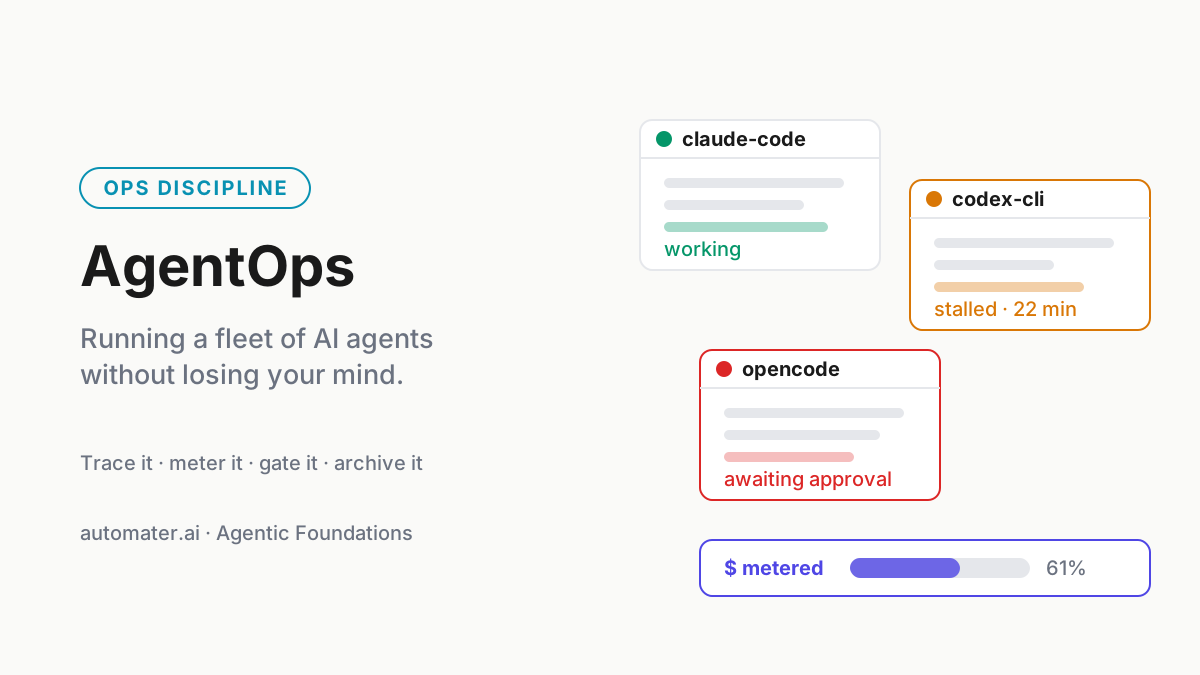
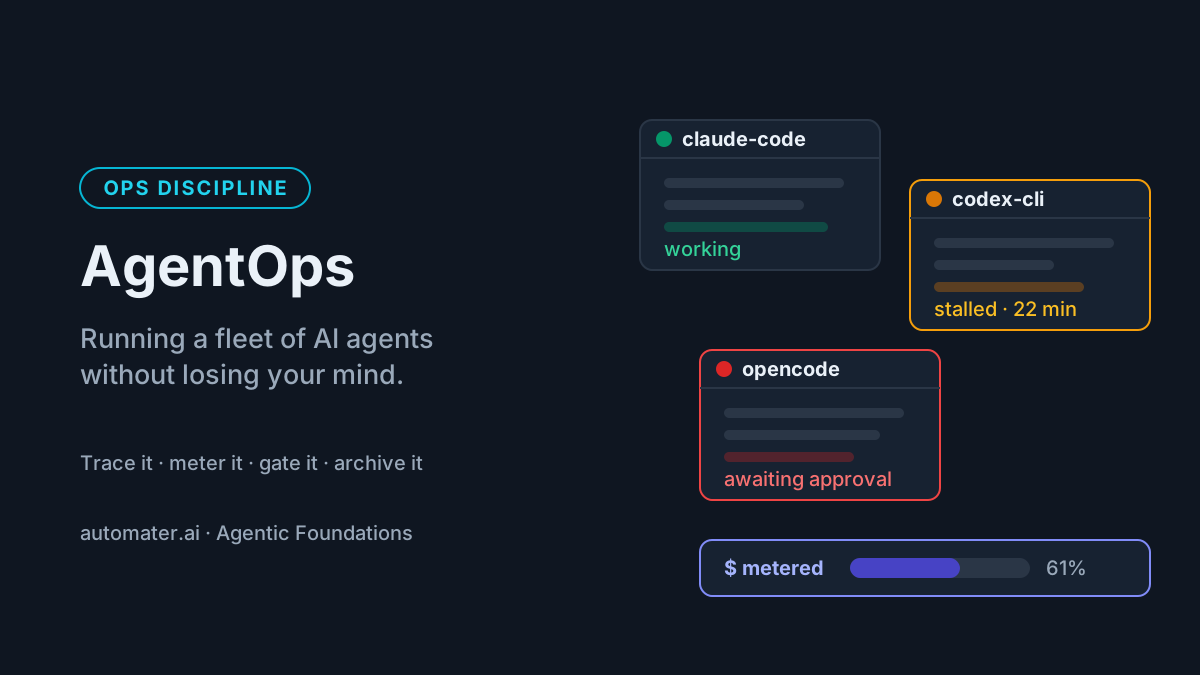
At this scale the scarce resource isn’t uptime; it’s attention. Personal fleet health means knowing at a glance which session is thinking, which has stalled, and which has been waiting twenty minutes on an approval prompt you never saw. An amber/green status row beats alt-tabbing through six terminals, for the same reason a dashboard beats ssh-ing into hosts one by one.
The session archive is your personal trace store. Yesterday’s transcript answers the questions production traces answer: what did the agent decide, which command failed, where is that fix from last Tuesday. If your transcripts vanish when a terminal closes, you’re operating without flight recorders.
And token budgets are personal too. Five subscriptions and three API keys keep spend invisible until the invoices land in five different inboxes. Per-provider metering across every CLI you run is the personal cost dashboard — the n=1 version of stack layer three. One more personal-scale lesson from 2026: harnesses die — ask anyone who had pipelines on Gemini CLI in June — so your archive and metering need to outlive any single tool, a point the harness die-off postmortem makes at industry scale. When you’re ready to run the whole fleet deliberately, the multi-agent command center guide is the full build-out.
Product note: This is what Automater Lite is: Fleet Awareness gives amber/green health and stall notifications across your installed CLIs, every session lands in a local searchable archive, and token metering shows spend per provider — personal AgentOps, free on automater.ai.
Metrics that matter
Four numbers cover most of what a fleet operator needs to know. For each: what it is, how to instrument it, and the caveat that keeps it honest.
- Task success rate, segmented by task type. Refactors, greenfield features, and triage are different sports; one blended number hides regressions in each. Instrument via eval verdicts plus human acceptance (merged PRs, approved outputs). Caveat: never measure success by agent self-report — agents grade themselves generously.
- Cost per successful run. Cost per run rewards cheap failures; dividing spend by successes prices what you actually bought. Instrument from per-run metering joined to success labels, and trend tokens-per-task to catch prompt rot and model drift early. Caveat: watch the tail — means hide the $400 outlier that matters most.
- Human-intervention rate. How often a run needs rescue — a correction, a manual finish, a revert. Instrument by tagging interventions in review, which costs one emoji’s worth of discipline. Caveat: falling intervention with stable success means earned trust; falling intervention with unknown success just means nobody’s looking.
- Mean time to detect a bad run. The scariest number, because semantic failures hide. Measure the lag between a bad run finishing and a human noticing, from timestamps in your archive and issue tracker. Caveat: if you can’t compute this one yet, that itself is the finding.
Collect baselines for a month before setting targets. Numbers you set before you can measure them are aspirations wearing SLO costumes.
A starter runbook for agent incidents
Paste this into your wiki and fill it in per agent. It is deliberately short; runbooks that take longer to read than the incident takes to worsen don’t get read.
# Agent incident runbook: <agent name>

## Trigger conditions (any of)

- Spend > $**_ per run, or > $_** per hour across runs
- No progress for \_\_\_ minutes (stall)
- Tool calls outside the expected set: <list>
- Eval gate failure on a production-bound change

## First diagnostics (in order)

1. Open the session transcript; find the last decision point.
2. Check spend for this run vs. the task-type baseline.
3. Diff the agent's config (prompt, tools, model) against last known good.

## Kill switch (write ALL that apply before you need any)

- CLI session: kill the process — `<command>`
- Scheduled agent: disable the trigger — `<where>`
- Cloud agent: revoke credentials — `<console/URL>`

## Rollback

- Revert agent-authored changes via: `<PR/branch procedure>`

## Comms

- Notify: <channel>. Page: <who> if customer-facing.

## Postmortem prompts

- Where in the transcript did the plan go wrong?
- Which gate should have caught it?
- REQUIRED: this postmortem ends in a diff — to an instruction
  file, a permission set, or an eval. Name the diff here.
Two usage notes. Start every diagnosis at the transcript: the session log is the flight recorder, and the wrong turn is almost always visible in it — quote it in the postmortem. And enforce the last field ruthlessly: a postmortem that doesn’t change an instruction file, a permission, or an eval is a story, and the incident will rerun on schedule.
Org patterns: who owns the agents
A concrete vignette, composited from mid-size SaaS orgs we’ve talked to: eighty engineers, agents writing maybe a fifth of merged code, one platform team of four. The split that works: the platform team owns the substrate — tracing, budgets, permission tiers, the eval harness — and product teams own their agents’ behavior: prompts, tools, and outcomes. It’s “you build it, you run it,” translated for autonomy.
Three practices keep that split from decaying:
- A lightweight agent review board. New agent roles, permission expansions, and production access pass a 30-minute review — the same threat-model questions every time, drawing on the security checklist from the guardrails layer. Not a committee; a checklist with two humans attached.
- Escalation paths defined before the first incident. Who gets paged for agent misbehavior, and — decided in advance — when a responder may override a running agent versus observe and record. That call is much worse improvised at 3 a.m.
- Agents folded into on-call honestly. Agent incidents join the same rotation, and the runbook above is the training material. Separate “AI on-call” rotations decay into one specialist who becomes a single point of failure.
Regulation has opinions here too, as of this month: the EU AI Act’s Article 50 transparency obligations took effect August 2, 2026, and they land on deployers — if your agents interact with people, disclosure is now an ownership question with a compliance deadline attached, not a philosophical one.
A maturity path: crawl, walk, run
- Crawl — see everything. Session archives for every agent, basic per-provider cost visibility, transcripts that survive the terminal. You cannot operate what you cannot see, and from what we see, most teams — and nearly all individuals — are here in 2026. You are here if: your last agent incident was reconstructed from memory and a scroll buffer.
- Walk — gate deliberately. Eval gates in CI, budgets with alerts, permission tiers, and the runbook written down. Call it the first month of deliberate practice. You are here if: a prompt change can’t reach production without an eval run, but a model upgrade still can.
- Run — automate the watching. Anomaly detection on cost and behavior distributions, canary rollouts by task type, fleet dashboards, a review-board cadence. You are here if: a bad run usually pages you before a human notices — and you can prove it with the time-to-detect metric.
Sequence beats speed. Skipping crawl is how walk fails: eval gates without traces argue about ghosts, and budgets without metering are wishes.
Make the autonomous boring
Agentic ops is the work of making autonomous systems boring — observable, budgeted, governed — at whatever scale you run them. Boring is the compliment. The agents supply the initiative; the operation supplies the guarantees, and the $400 overnight loop dies in the first week of it: a spend alert at $20, a stall notification at thirty minutes, a transcript that shows the doom loop by breakfast.
The prescription compresses to two sentences. Instrument first — archive plus cost — then gate: evals plus permissions. Then, and only then, automate the watching. If you operate a production fleet, fully instrument one agent this sprint and let it embarrass the rest into compliance. If your fleet is three terminals on a laptop, set up the archive and the metering tonight; the discipline is the same, only the pager is quieter.
FAQ: agentic ops
What is AgentOps (agentic ops)?
AgentOps — also called agentic ops or agent ops — is the operational discipline of deploying, monitoring, evaluating, and governing AI agents. It keeps autonomous systems observable, affordable, and safe: versioned prompts and permissions, traced runs, eval gates in CI, cost budgets, and incident runbooks, at fleet or personal scale.
Is AgentOps the same as MLOps?
No. MLOps operates model artifacts — weights, datasets, training pipelines — and monitors drift and prediction quality. AgentOps operates runtime behavior: tools, prompts, permissions, multi-step state, and cost. A model registry can’t catch an agent broken by a renamed CLI flag; a run trace can.
What does non-agentic mean?
Non-agentic describes systems with fixed, deterministic, pre-scripted execution and no runtime choice of method — cron jobs, CI pipelines, Ansible playbooks, Zapier flows. The same input produces the same behavior every time. That predictability is a feature: deploys, backups, and migrations should stay non-agentic on purpose.
What is a DevOps AI agent?
A DevOps AI agent does operations work itself: correlating an error spike with last night’s deploy, drafting the rollback PR, executing permissioned runbooks, or rightsizing infrastructure. The governing rule is that agents propose and pipelines apply — every change still flows through PR review, CI, and human gates.
What metrics should I track for AI agents?
Four cover most needs: task success rate segmented by task type, cost per successful run (not per run), human-intervention rate, and mean time to detect a bad run. Instrument all four from traces and your session archive, and collect a month of baselines before setting targets.
Sources
- OpenTelemetry — GenAI semantic conventions
- LangChain — LangSmith observability
- Langfuse — open-source LLM engineering platform
- Braintrust — evals and observability
- Arize — Phoenix observability
- PagerDuty — AI operations features
- incident.io — AI incident response
- US government Cybersecurity Information Sheet — Model Context Protocol security (June 2026)
- EU AI Act — Article 50 transparency rules