MIT Ties Data Center Electricity to About 650 Premature US Deaths in 2023, With the Harm Landing Far From the Facilities
MIT traces 2023 data center electricity through grid and air, estimating about 650 premature US deaths, with per-capita peaks in states hosting few of them.
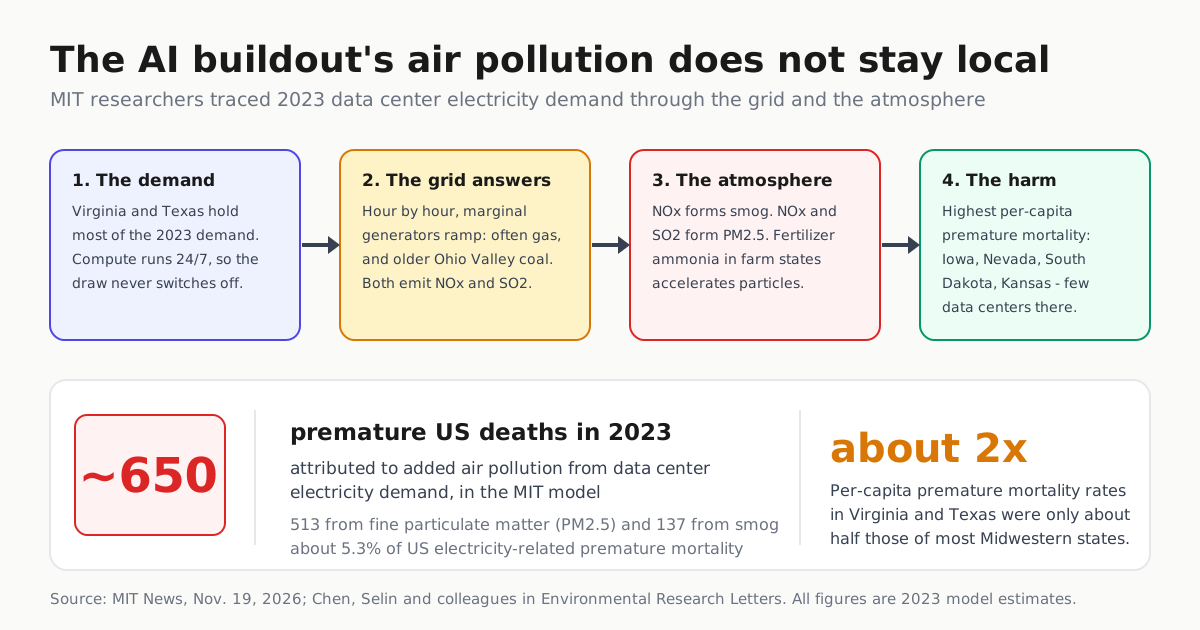
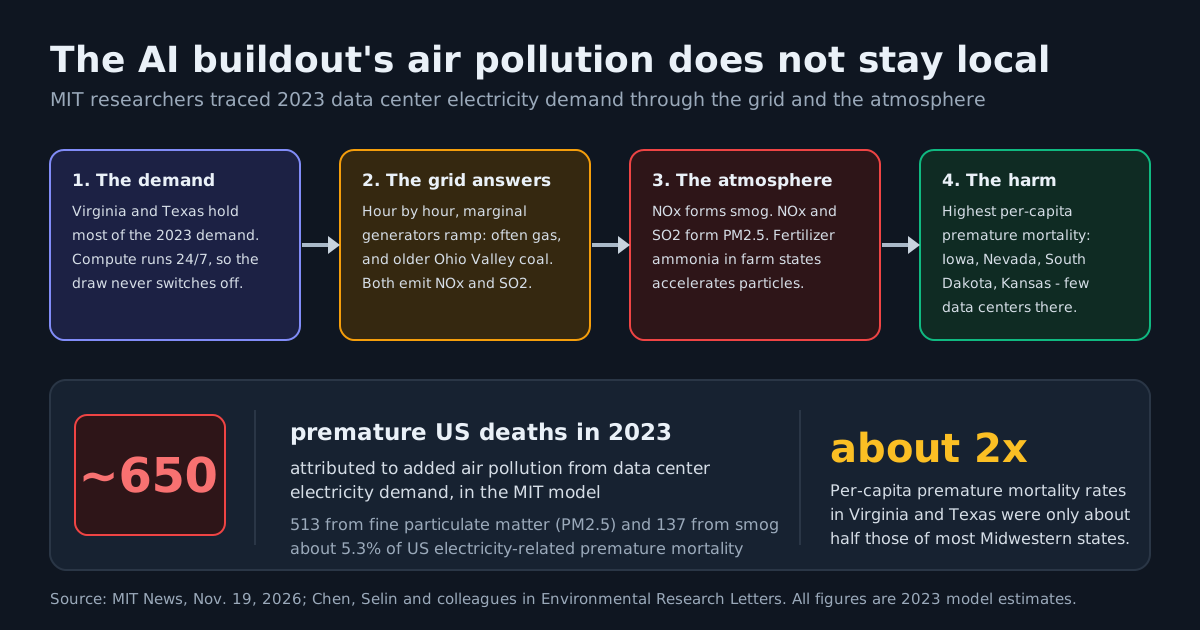
The address of a data center is not the address of its exhaust. That is the central result MIT researchers published Nov. 19 in Environmental Research Letters: added air pollution from the electricity US data centers demanded in 2023 caused an estimated 650 premature deaths nationwide, and several of the states with the highest per-capita rates host comparatively little of the compute.
The number, and the mismatch inside it
Noelle Selin, a professor in MIT’s Institute for Data, Systems, and Society and the Department of Earth, Atmospheric and Planetary Sciences and the study’s senior author, framed the finding in MIT News’ announcement: “When people think about the negative impacts of data centers, they usually focus on the neighbors. But our study indicates that the air quality impacts of data centers are very widespread across a large region.”
| Figure | Estimate | Detail |
|---|---|---|
| Data centers’ share of US energy demand, 2023 | About 4% | Lawrence Berkeley National Laboratory estimate cited by MIT News |
| Share of national emissions | About 4.4% | Same estimate; likely higher now |
| Premature US deaths attributed to 2023 data center electricity | About 650 | 513 from PM2.5, 137 from smog |
| Share of US electricity-related mortality | About 5.3% | Model estimate |
| Highest per-capita mortality rates | Iowa, Nevada, South Dakota, Kansas | Most demand sits in northern Virginia and Texas |
| Virginia and Texas per-capita rates | About half of most Midwestern states | Grid interconnection plus downwind transport |
| Rural versus urban risk | Rural significantly higher | Per MIT graduate student and co-author Yuang (Albert) Chen |
Why the harm lands somewhere else
Two mechanisms move the damage. The first is the interconnected grid: generators responding to new demand in Virginia are likely located in the Ohio Valley, where a higher proportion of older coal and gas plants means more emissions per unit of added load. “Different regions have different mixes of power,” Selin says. “If you turn on a major new demand source, by plugging a data center into the grid, you might have to fire up your really dirty power plant to meet that new demand.”
The second is atmospheric chemistry and transport. NOx contributes to ground-level ozone, and both NOx and SO2 contribute to fine particulate matter. In agricultural states such as Nebraska and Iowa, ammonia from fertilizer enhances PM2.5 formation, and estimated impacts extend into Kansas, South Dakota, Missouri and Arkansas, states with relatively few data centers.
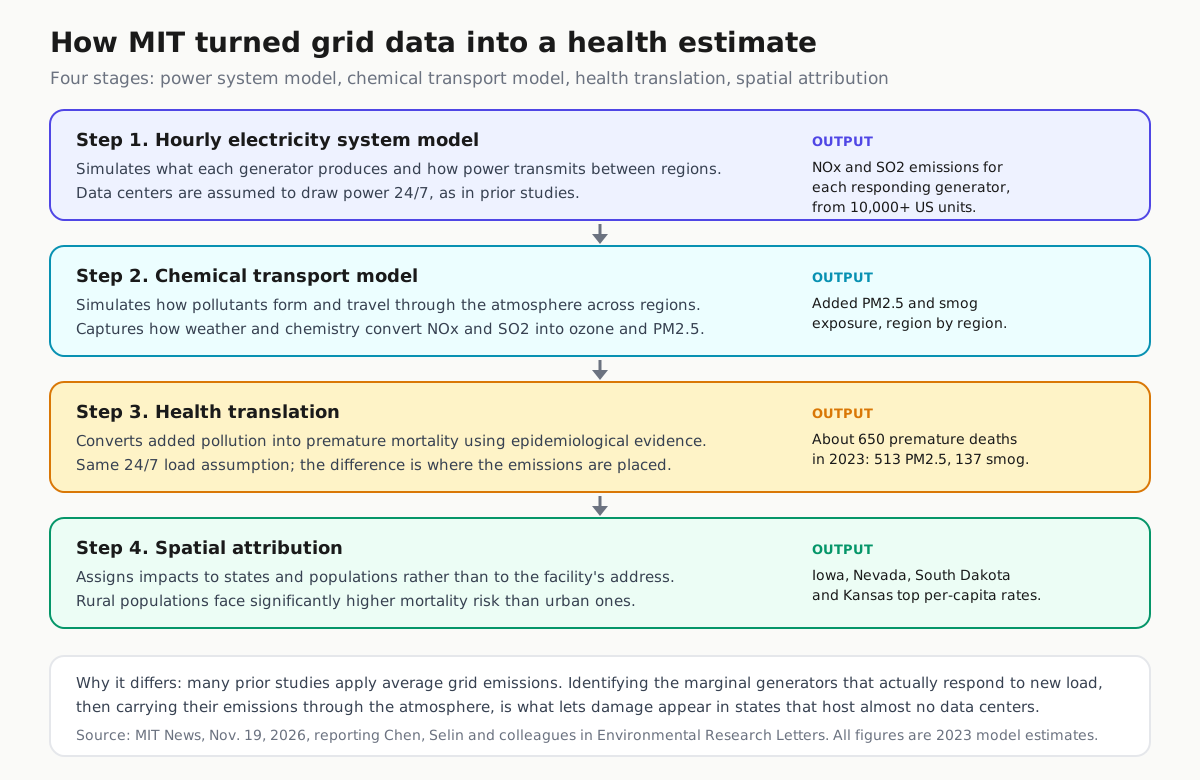
The method matters more than the headline count. Many prior studies apply average grid emissions. This team built an hourly electricity system model that simulates what each generator produces and how power transmits between regions, fed generator-level NOx and SO2 into a chemical transport model, then translated the added pollution into premature mortality using evidence from the epidemiological literature. Chen, an MIT graduate student, says the data work covered more than 10,000 generators. Identifying which units actually respond to new load, hour by hour, is what lets damage appear in a state that hosts almost no compute.
What this changes for people who buy compute
Chen’s recommendation is operational: “When people are thinking about data center siting and operations, it is important to consider more than just things like land and energy prices. They should also take air quality considerations into the equation.”
Three consequences follow. Marginal emissions are not average emissions, so a clean-power purchase in one region does not neutralize the load a campus adds elsewhere in an interconnected system. Demand flexibility becomes a health lever as well as a cost lever; the researchers list adaptively adjusting electricity demand among their next questions, alongside onsite generation, the growing practice of data centers bringing their own power plants. And siting politics now carries a quantified externality, the kind of number legislatures, utilities and permitting bodies actually use.
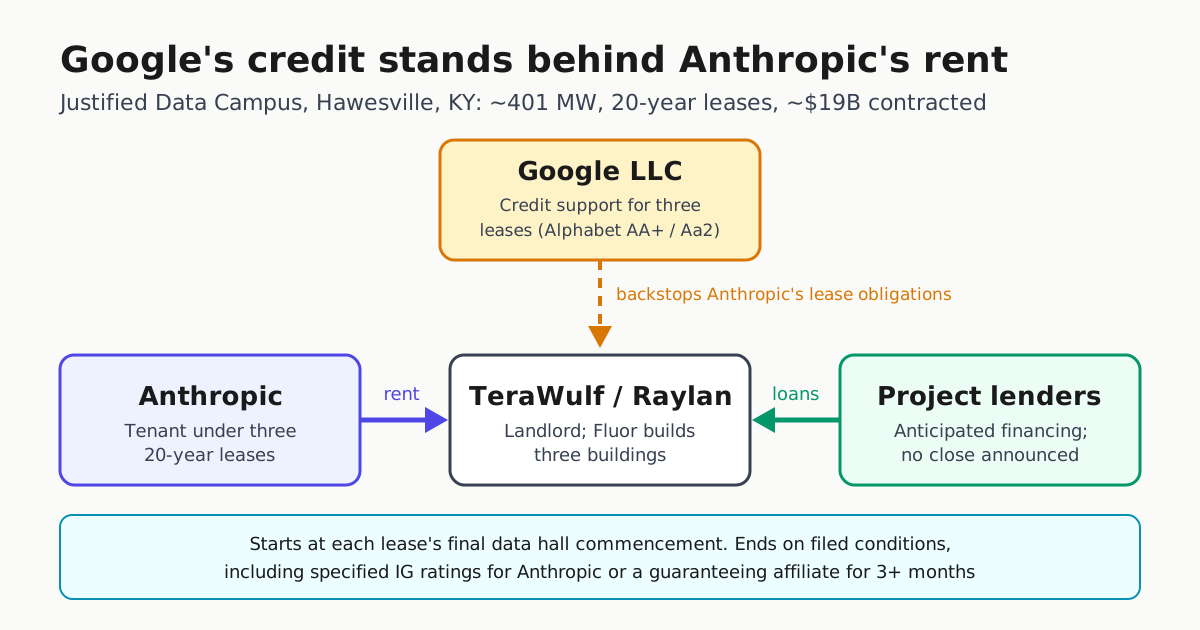
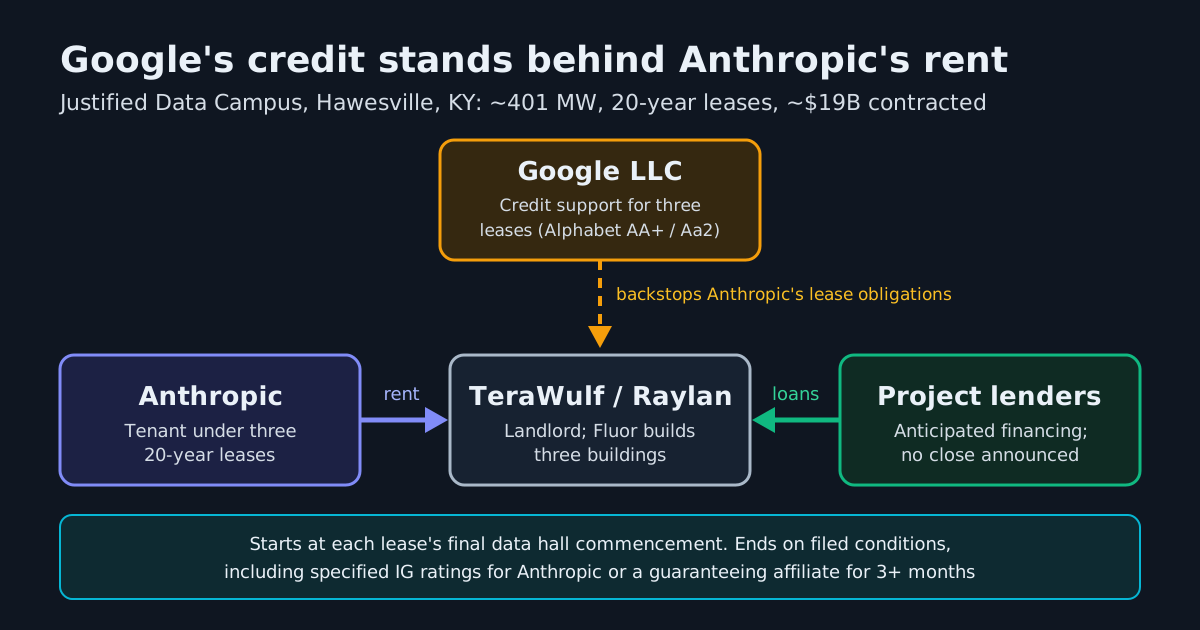
The industry has begun responding to grid strain on the demand side. OpenAI’s Grid Protectors program asks future compute campuses to pledge to cut power when the grid is strained, and Google’s backstop of Anthropic’s $19B Kentucky data center leases shows how much capital rides on one siting decision. Microsoft’s plan to make Azure Maia its primary inference system, with multi-gigawatt scale from 2027, points the same way: load is growing faster than the siting conversation.
A second measurement, the same day
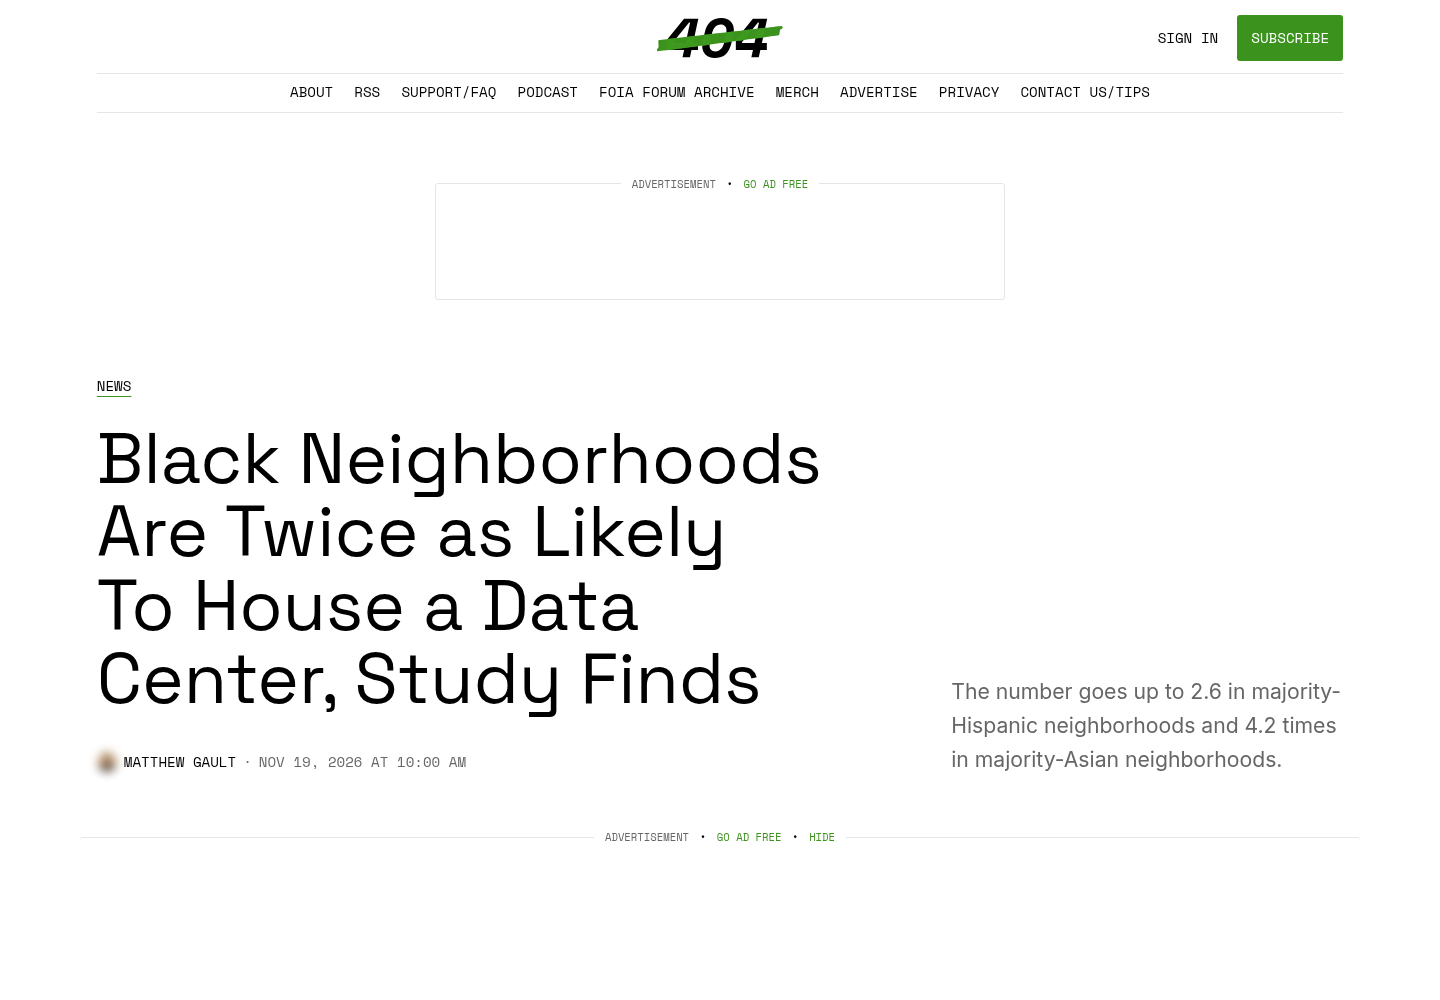
The MIT paper asks where pollution goes. A study reported the same day asks where the buildings go. 404 Media reports that researchers at George Washington University and the Center for Security, Innovation & New Technology at American University examined 81,000 US census tracts and location data for 5,291 data centers, and found majority-Black neighborhoods have 2.2 times the odds of hosting a data center compared with a white neighborhood in the same state, rising to 2.6 times in majority-Hispanic and 4.2 times in majority-Asian neighborhoods. The disparities persist after accounting for population, household income, education, land costs, proximity to major transmission lines and state fixed effects.
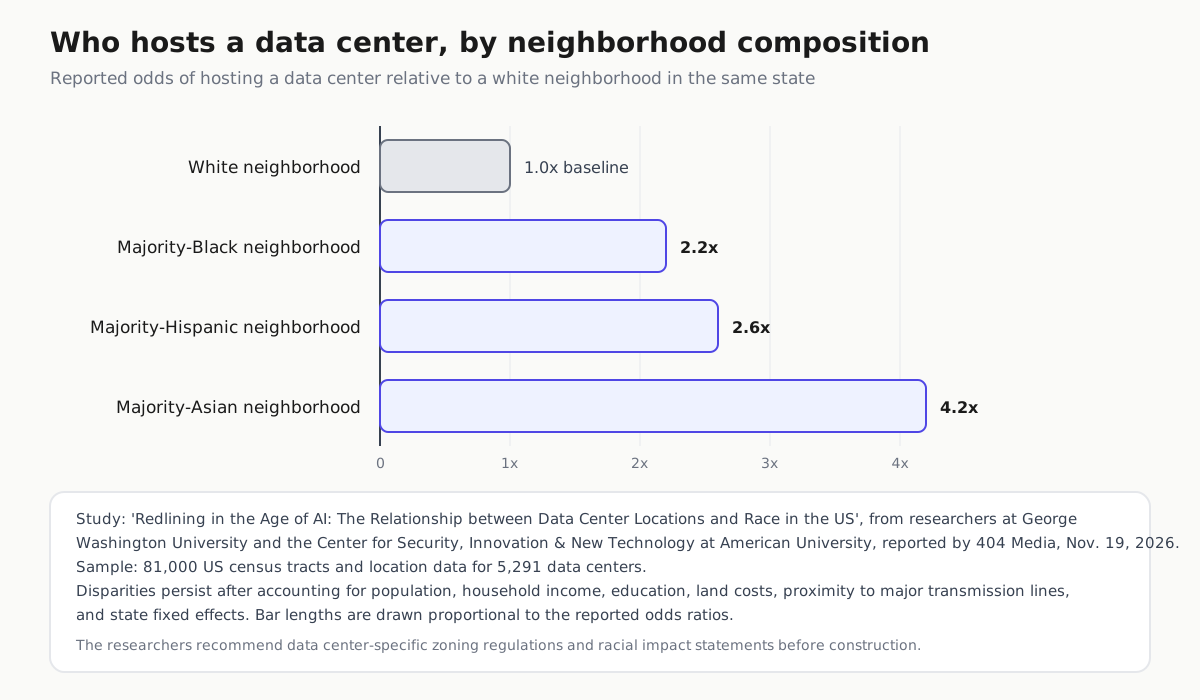
Read together, the two describe one system from both ends: facilities concentrate in particular neighborhoods, while the air-quality consequences disperse across a wider and largely rural geography. The GWU and CSINT researchers recommend data center-specific zoning regulation and racial impact statements before construction.
The buildout keeps spreading
In a sponsored SiliconANGLE segment recorded at SC26, Vultr chief marketing officer Kevin Cochrane said the company now operates 34 cloud data center regions, the latest in Chennai, India, and argued sovereignty requirements reach past national governments to enterprises whose data cannot cross borders. He cited the US Commerce Department’s new curbs on remote chip access as evidence regulators are tightening. SiliconANGLE discloses that Vultr sponsored the segment and has no editorial control. Sovereignty-driven duplication means more regions and more sites, which spreads the siting fight to more jurisdictions, exactly where both studies will now be cited.
What the estimate does not claim
About 650 is a modeled attribution, not a body count. It derives from simulated emissions, atmospheric chemistry and concentration-response relationships drawn from epidemiological literature, for a single year. MIT News notes the data center share of demand has likely risen since, so the same framework applied to a later year could produce a different, likely larger, number. The 4% and 4.4% demand and emissions shares come from Lawrence Berkeley National Laboratory, not from this model. What the study does establish is direction and geography: the harm is real, it is exported, and many of the communities absorbing it were never in the siting conversation.