
Anthropic Usage Dashboards Errored Twice in a Day: What Claude Fleet Operators Should Reconcile
Anthropic's status feed reported usage-data errors on the platform.claude.com Usage and Rate limits pages and the Admin API usage report twice inside one UTC day, with a mitigation rolling out and roughly 30 minutes of lag on recent usage. Here is what fleet operators should reconcile.
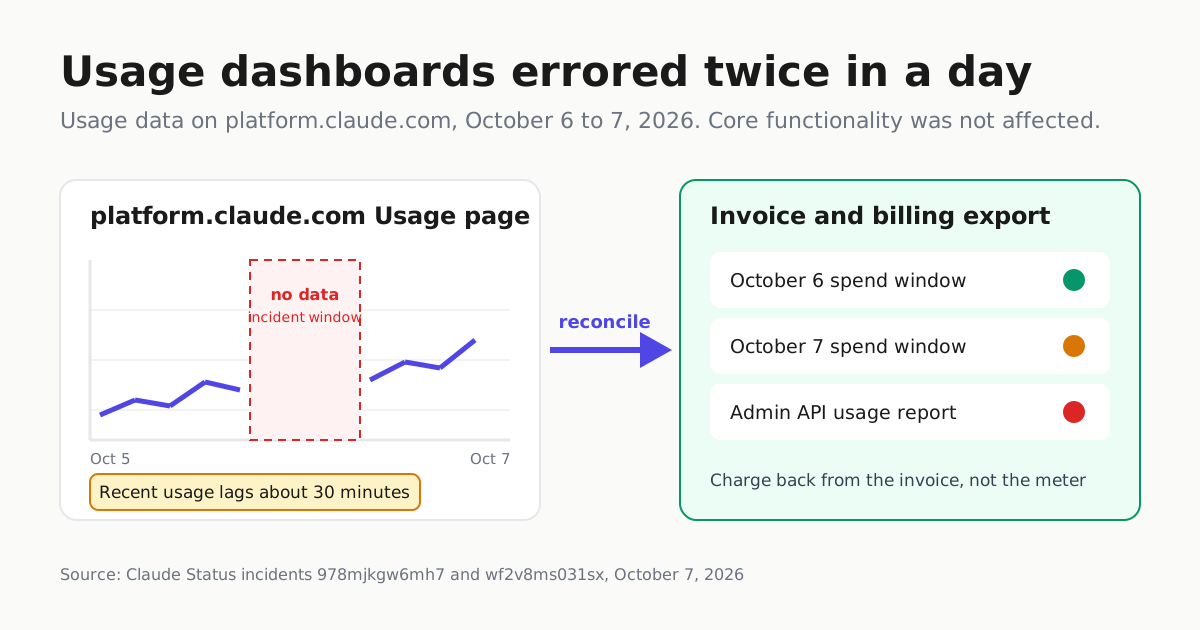
If your Claude spend dashboard refused to load, or came back looking suspiciously cheap, on October 6 and 7, 2026, the problem was the meter, not your fleet. Anthropic’s status feed reported two separate incidents of elevated errors hitting usage data on platform.claude.com inside the same UTC day, and the second was still in mitigation at the last update captured here.
What the status feed says
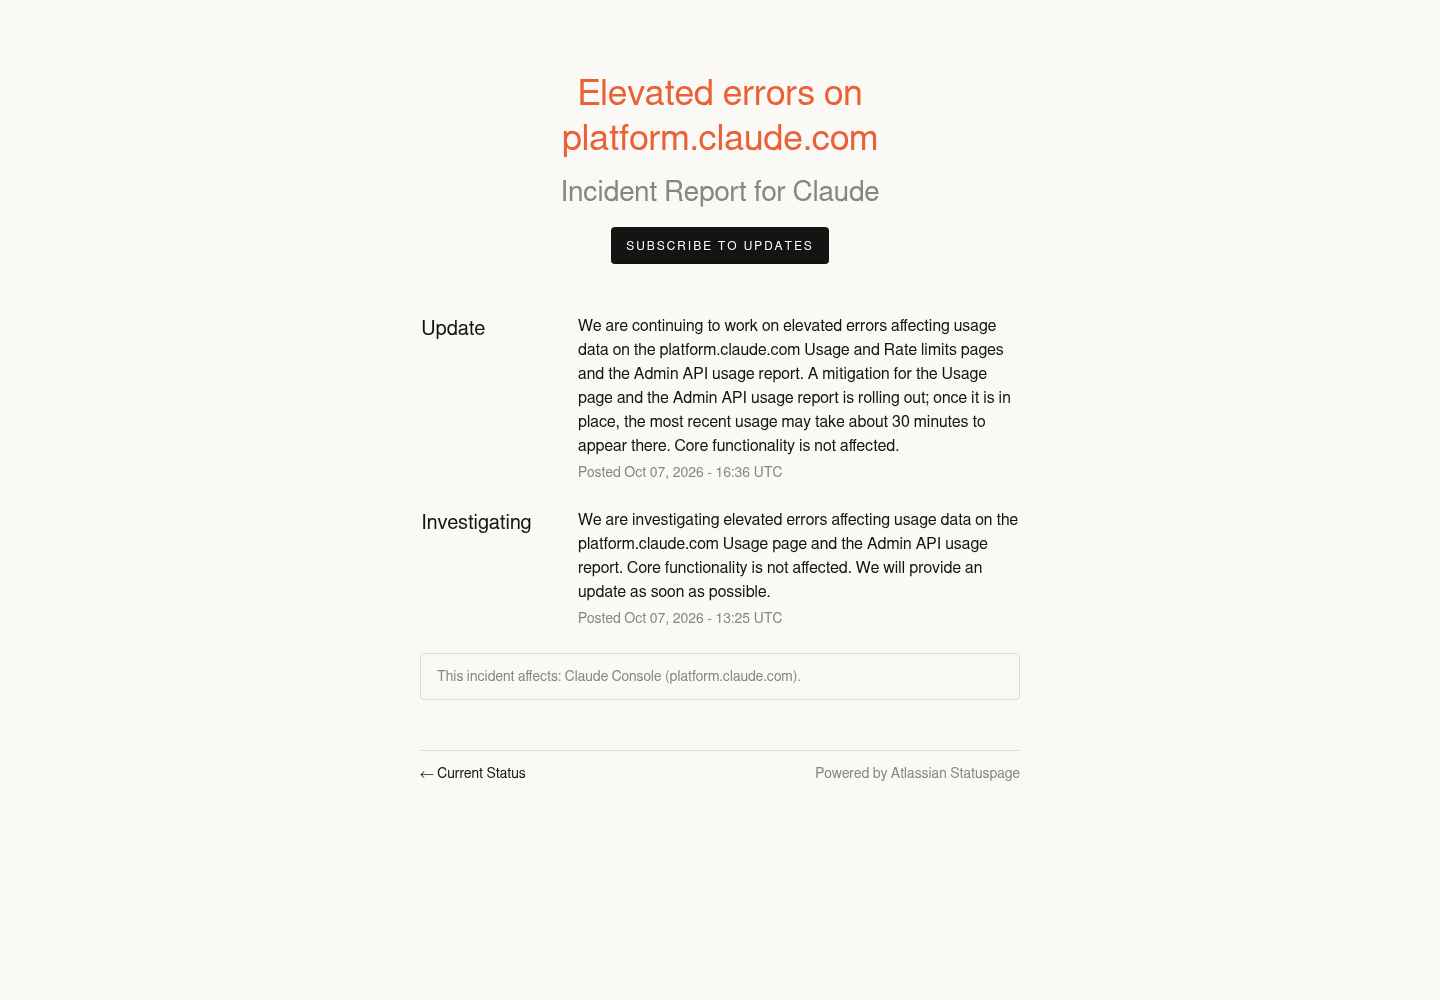
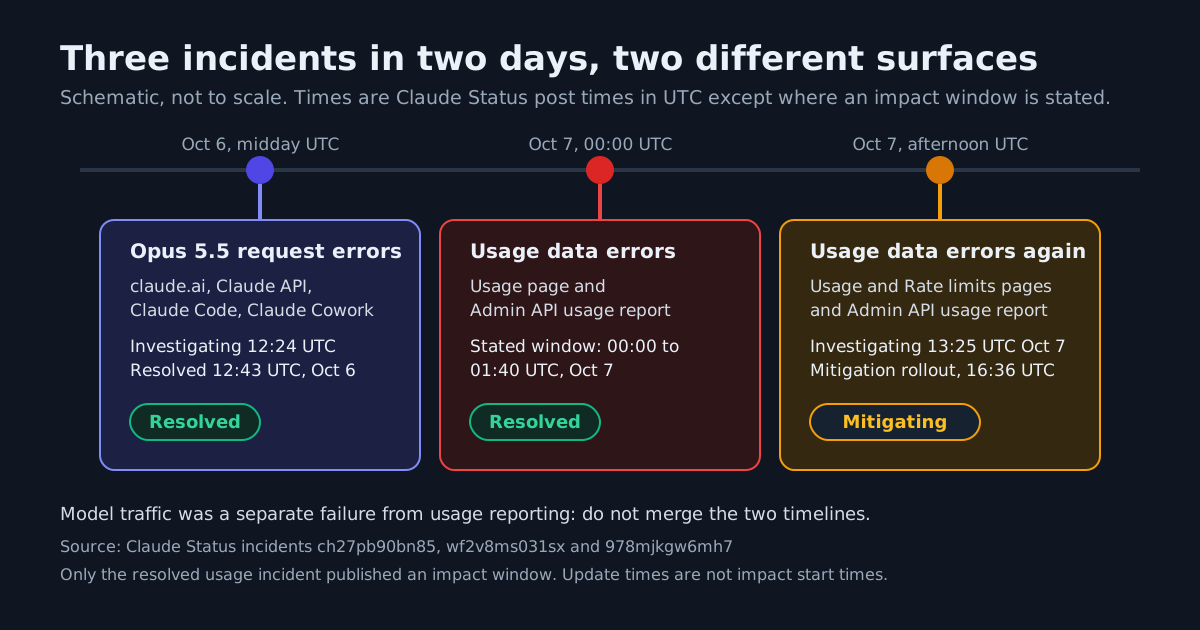
The incident still open at capture, “Elevated errors on platform.claude.com”, was posted as investigating at 13:25 UTC on October 7. It covered elevated errors affecting usage data on the platform.claude.com Usage page and the Admin API usage report, with the note that core functionality was not affected. By the 16:36 UTC update the surface list had grown to include the Rate limits page, and Anthropic said a mitigation for the Usage page and the Admin API usage report was rolling out. The caveat operators should build around: once the mitigation is in place, the most recent usage may take about 30 minutes to appear.
That was the second hit that day. The earlier incident, “Elevated errors loading usage data on platform.claude.com”, ran from 00:00 to 01:40 UTC on October 7 (17:00 to 18:40 PT on October 6), when many requests to load usage data on the Usage page and the Admin API usage report returned errors. It was marked resolved in a notice posted at 02:33 UTC, and its investigating notice also stated that Messages API requests were not affected.
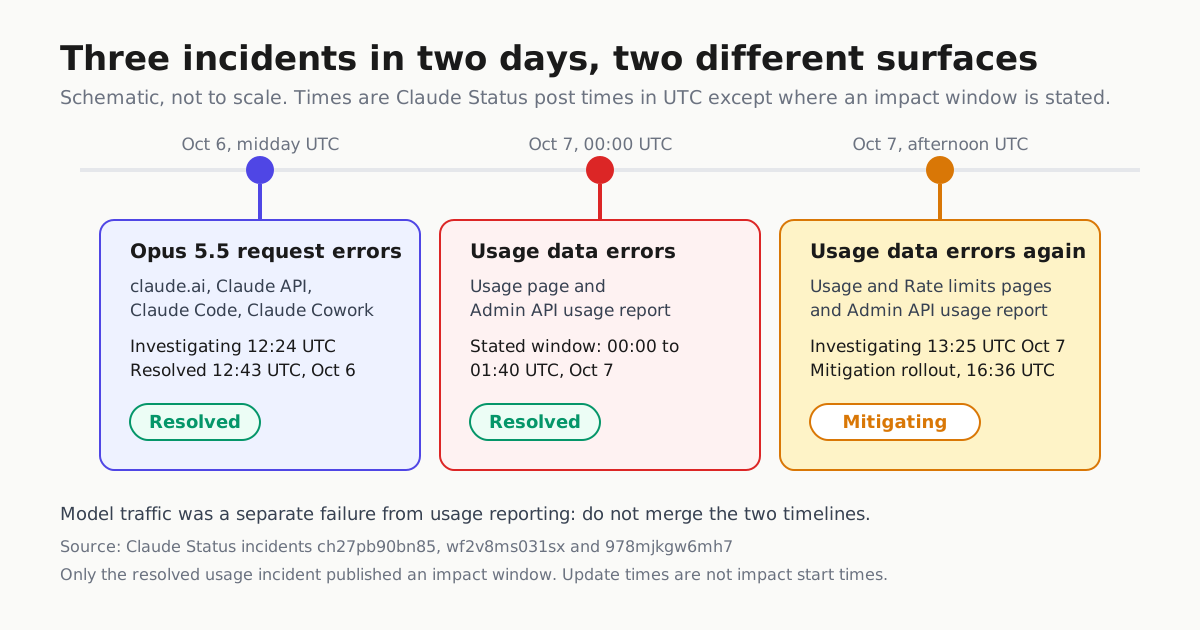
Put the two usage incidents alongside the separate Opus 5.5 notice and the shape of the week is clear: usage reporting broke twice, model serving errored once, separately.
| Incident | Surfaces named | Times (UTC) | Status at capture |
|---|---|---|---|
| wf2v8ms031sx | Usage page, Admin API usage report | Stated impact window 00:00 to 01:40, Oct 7 | Resolved, posted 02:33 Oct 7 |
| 978mjkgw6mh7 | Usage page, Rate limits page, Admin API usage report | Investigating posted 13:25, update 16:36, Oct 7 | Mitigation rolling out, not resolved |
| ch27pb90bn85 | claude.ai, Claude API, Claude Code, Claude Cowork | Posts 12:24 to 12:43, Oct 6 | Resolved |
Read the times carefully: publisher update times are not impact start times, and only the resolved usage incident published an actual impact window.
Why a reporting outage is still a fleet incident
The three broken surfaces are the meters. If you run Claude or Opus agents in numbers, the Usage page is where humans sanity-check spend, the Rate limits page is where they check headroom, and the Admin API usage report is what your automation polls to build dashboards and chargeback reports. When those error out, nothing stops: the status pages said core functionality was unaffected and, in the earlier incident, that Messages API traffic was unaffected too. Your agents kept spending while the instruments that measure them were down.
That combination produces quiet failures. A spend dashboard reads low rather than zero. A chargeback report under-allocates October 6 and 7 to the teams that burned the most tokens. A cost-anomaly alert keyed on the usage report never fires because its input is incomplete rather than high. And if you checked the Rate limits page during the second incident, whatever you saw was stale or an error.
What to reconcile now
| What you metered | Risk | What to do |
|---|---|---|
| Same-day Admin API usage pulls for Oct 6 to 7 | Dropped rows, failed requests, understated totals | Re-pull both full windows after mitigation lands, then diff against what you recorded |
| Spend dashboards and chargeback reports | Understated Claude and Opus spend for the window | Reconcile against the invoice or billing export, not the live meter, as with any gateway chargeback |
| Cost-anomaly alerts | Overspend missed because inputs read low | Backfill the window once reporting recovers, then re-run alerts; treat degraded reporting as its own alert condition, not silence |
| Rate-limit headroom checks | Stale or erroring page | Trust 429 responses from the lanes themselves over the page until it is visibly current |
A reconciliation note you can paste into the incident log:
# illustrative: usage-reporting incident reconciliation
window:
  start: 2026-10-06T00:00:00Z
  end:   2026-10-08T00:00:00Z
meters_affected:
  - platform.claude.com Usage page
  - platform.claude.com Rate limits page
  - Admin API usage report
expected_lag_after_mitigation_minutes: 30
fallback_source: invoice or billing export
action: re-pull window, diff recorded pulls, re-run cost alerts
What Anthropic did not say
Neither usage incident published a root cause, an error rate, or an affected-customer scope; only status-page facts are on offer here. The second incident was not marked resolved as of the 16:36 UTC update, so check the status page before trusting any pull you make today, and treat same-day usage data from October 6 and 7 as provisional until it reconciles against the invoice.
The Opus 5.5 incident is a different failure
A separate, earlier notice, “Elevated errors for Claude Opus 5.5”, was posted as investigating at 12:24 UTC on October 6, identified at 12:37 UTC, and marked resolved at 12:43 UTC the same day. It affected claude.ai, the Claude API at api.anthropic.com, Claude Code and Claude Cowork, which is model traffic itself, not usage reporting. Keep the timelines separate in your own incident review: a fleet that saw request errors at midday on October 6 and missing usage rows on October 7 experienced two unrelated faults.
The bottom line
Model traffic and its measurement failed independently this week, and only the measurement failed twice. Treat the October 6 and 7 usage numbers as a meter outage: re-pull the windows after the mitigation lands, expect roughly 30 minutes of lag on recent usage, and reconcile chargebacks against invoices for those two days. Longer term, wire the provider status feed into any dashboard that reads a usage meter, and alert on degraded reporting separately from zero usage, the same separation we recommend for cost anomaly alerts and for knowing which meter you are actually reading.