Grafana MCP: Inspect a Dashboard and Verify a Bounded Query
Connect Grafana MCP to Claude Code, inspect a panel’s datasource and variables, run a bounded Prometheus query, and compare the same inputs in Grafana safely.

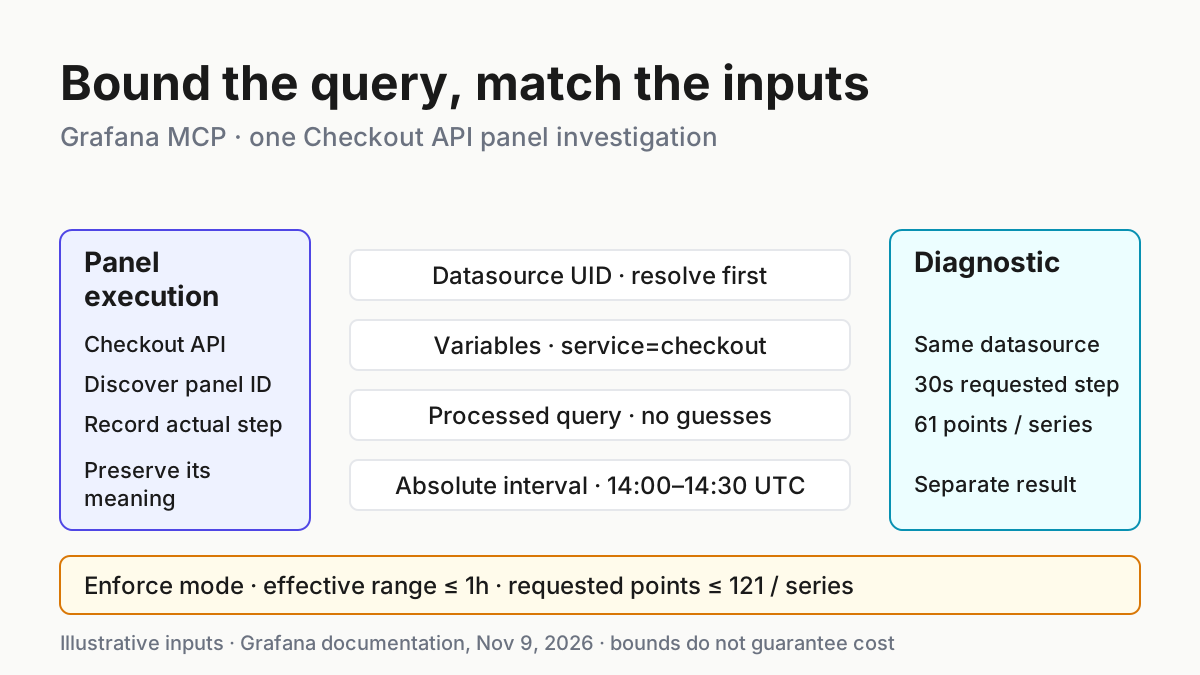
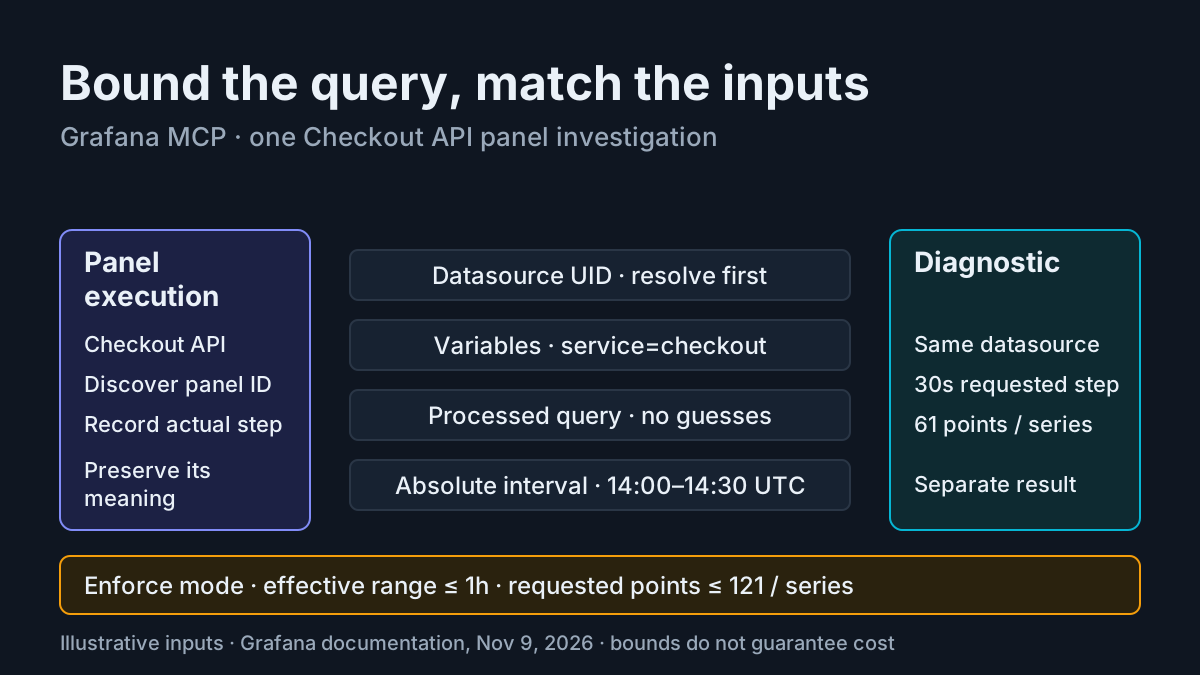
A Checkout API panel looks wrong, and you want Claude Code to investigate it without changing the dashboard. The difficult part is preserving the panel’s meaning: its actual datasource, selected variables, processed query and time window. Grafana MCP can expose those inputs and execute the query, but a connected server alone does not prove that its credentials can read your dashboard or query its datasource.
This tutorial is for a developer with an authorized Grafana 9.0+ instance, Claude Code and an installed mcp-grafana binary. You will register a local server, inspect one existing Prometheus panel, run a diagnostic query under explicit limits and produce a comparison report. The worked case is illustrative throughout; no commands or queries were executed for this article.
Grafana’s November 2, 2026 release supplies the compatibility context: v2.2.0 introduces opt-in Prometheus query guardrails and improves dashboard-variable processing. Its queries use Grafana’s query service, requiring Grafana 9.0 or later and appropriate datasource permissions. The practical task below remains the same regardless of the release announcement.
Prepare one investigation with explicit boundaries
- Choose an existing dashboard you are authorized to inspect. For the illustrative case, its title is Checkout API and the variable selection is service=checkout.
- Fix the interval to 2026-11-08T14:00:00Z through 2026-11-08T14:30:00Z. These are example investigation inputs, not an assertion that your instance retains data for that date.
- Obtain an approved service account token with dashboard-read and datasource-query permissions scoped to the intended resources.
- Confirm that your installed binary supports the flags used below before registering it.
The panel-query guide requires dashboards:read and datasources:query with the relevant scopes. The Prometheus guide specifically identifies datasource scope such as datasources:uid:<uid>. Ask your administrator for the appropriate existing access; this tutorial does not grant permissions or create identities.
Keep the distinction between the Grafana service account and your browser session visible. You may see a dashboard in Grafana while the service account cannot read it. You may also read dashboard metadata successfully while datasource execution fails. Neither observation is contradictory: the calls exercise different permissions. A successful comparison needs both paths to reach the intended datasource.
For authentication, the official authentication reference recommends GRAFANA_SERVICE_ACCOUNT_TOKEN. It also supports GRAFANA_SERVICE_ACCOUNT_TOKEN_FILE, read afresh on each request. The copyable configuration below uses the documented inline environment form; replace its token locally and keep the resulting configuration private. Never paste the populated token into an investigation prompt or report.
For general scope selection, see Claude Code MCP setup. This guide deliberately uses the default local scope, available only to you in the current project. Shared project configuration is unnecessary for this single-developer investigation.
Register a local server that can read and query
- In the project where you will investigate, inspect existing registrations with claude mcp list. If grafana already exists, preserve its prior configuration before replacing anything.
- Check the installed binary’s help and version.
- Register the configuration below after replacing the two environment values with your approved instance and token.
- Start a new Claude Code session and ask it to list your Grafana dashboards.
mcp-grafana --version
mcp-grafana --help
claude mcp list
# Expected: inspect the installed version, supported flags and existing registrations.
The command-line reference documents --version and recommends --help for the exact installed build. If that help lacks the Prometheus guardrail options, stop before using this configuration. An older binary cannot enforce a flag it does not implement. Confirm the supported installation with your administrator rather than silently removing the limits.
claude mcp add-json "grafana" '{
  "command": "mcp-grafana",
  "args": [
    "-t", "stdio",
    "--enabled-tools=search,datasource,dashboard,prometheus,runpanelquery",
    "--disable-write",
    "--prometheus-guardrail-mode=enforce",
    "--prometheus-guardrail-max-range=1h",
    "--prometheus-guardrail-max-points=121"
  ],
  "env": {
    "GRAFANA_URL": "https://myinstance.grafana.net",
    "GRAFANA_SERVICE_ACCOUNT_TOKEN": "<your-token>"
  }
}'
claude
The registration syntax and local default come from Grafana’s Claude Code client documentation. The example hostname is an illustrative replacement value. Use your authorized base URL; do not redirect an existing organization’s registration to an unrelated instance. The binary must be in PATH, or command must contain its actual full path.
The small tool list is intentional. Tool selection says --enabled-tools replaces the default list. Here it exposes the categories needed for searching, datasource discovery, dashboard inspection, Prometheus queries and panel execution. runpanelquery is normally disabled, so omitting it would prevent the central execution step.
–disable-write retains reads and safe query tools while removing write operations. It does not make queries free or prevent data disclosure through authorized reads. Do not add --disable-query: that would remove query_prometheus and run_panel_query, defeating this investigation. Do not add write-tool exceptions to fix a read failure. Correct the missing permission or category instead.
This example selects the installed binary path to keep transport and credential handling straightforward. If your established environment uses containers, Grafana’s Docker instructions require -i and -t stdio for a direct client connection; the image otherwise defaults to SSE. Container networking also changes what localhost means. Avoid mixing a container URL assumption into this host-binary configuration.
After startup, check capabilities before asking for telemetry. The intended result is access to dashboard search and inspection, datasource discovery, Prometheus execution and panel execution. A missing panel runner points first to the optional category, while missing Prometheus execution also warrants checking whether query execution was disabled. These are registration questions; they do not require changing the dashboard or widening the service account’s permissions.
Discover the panel before composing its query
- Ask Claude to search for Checkout API and show matching titles and folders.
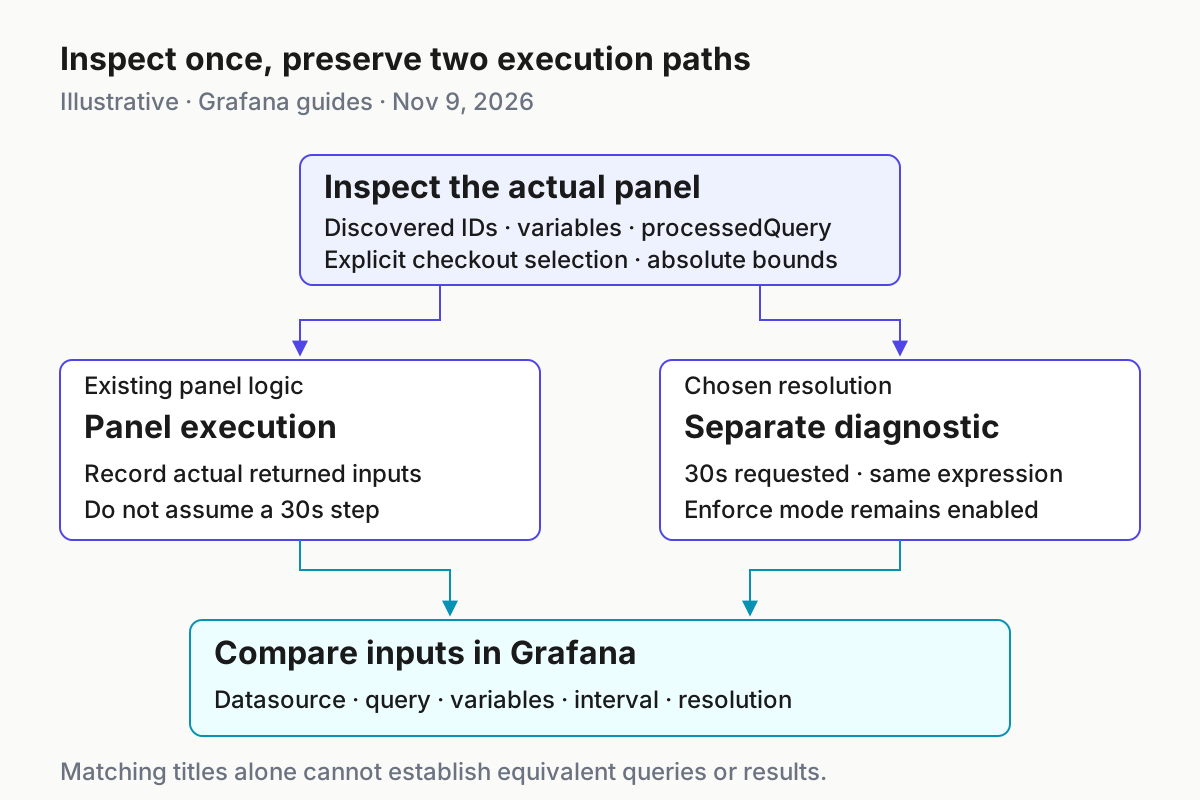
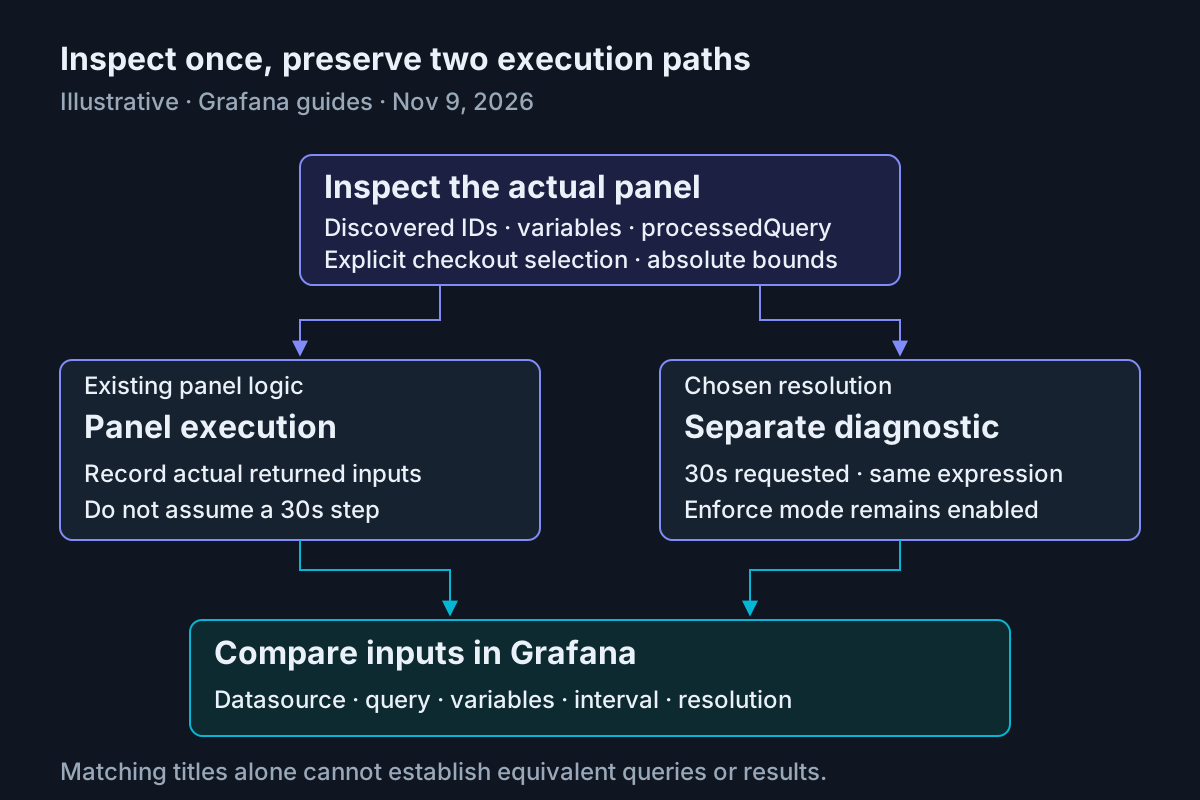
- Select the intended dashboard from the actual results, then ask for its summary and panel queries.
- Choose one Prometheus panel and record its returned dashboard UID, panel ID, datasource UID and datasource type.
- Request processed query text with service=checkout and the fixed absolute start and end.
The dashboard-inspection documentation supports this progression without fetching full dashboard JSON. Summaries expose variables and panel metadata; panel-query inspection returns query strings and datasource identifiers. Do not invent a plausible dashboard UID from its title. UIDs and panel IDs in the later execution must come from these results.
Use the following complete prompt after registration. It asks the assistant to resolve identifiers rather than substituting fake production values into an API call. Exact tool input schemas should come from the connected server; the supplied guides document the workflow but do not enumerate every JSON argument.
Investigate task:grafana-panel-01 using the Grafana MCP tools.
Do not create or update dashboards, alerts, annotations or other resources.

Search for the existing dashboard titled Checkout API. Show matching
folders and ask me to choose if the match is ambiguous. Obtain its actual
dashboard UID from search. Get its summary and panel queries.

Select one existing Prometheus panel relevant to service checkout.
Report its actual panel ID, title, datasource UID and datasource type.
If no such panel exists, stop and explain the mismatch.

Prepare its processed query with explicit variable override service=checkout,
start 2026-11-08T14:00:00Z and end 2026-11-08T14:30:00Z.
Show saved query text, processedQuery and any warnings. Do not accept All
as the service selection. Do not guess unresolved variable values.

Run that panel query with the discovered identifiers, same variables and
absolute interval. Record the returned query inputs, actual step if exposed,
and result or exact error. Do not claim a 30s panel step unless observed.

For a separate bounded Prometheus diagnostic, use the same datasource
and processed PromQL only if it is fully resolved and supported. Request
a range query over the same interval with step 30s using the tool schema.
If the guardrail rejects it, preserve the error and narrow the request;
do not disable or weaken enforce mode.

Return Observed data, Interpretation, Unknowns and Grafana comparison
inputs. Distinguish panel execution from the separate diagnostic.
Do not invent values, tool results, UIDs or successful comparisons.
A variable named service is an illustrative prerequisite for this case. If the actual dashboard uses a different variable, identify that mismatch explicitly and adapt the investigation with the owner’s intended selection. An unresolved $service is not equivalent to checkout. Likewise, a saved All selection is not an acceptable substitute for a single-service diagnostic.
Inspection with variables: {} uses saved selections; explicit overrides replace that ambiguity. The documentation warns when a referenced variable is All. It also says inspection does not query variable options or look up datasource types. Consequently, inspect the returned evidence carefully and confirm the actual datasource rather than treating every inspection field as independently validated.
If search returns two dashboards named Checkout API, compare the returned folder metadata and ask the dashboard owner which one represents the service under investigation. Choosing the first match would leave every later query technically plausible but attached to the wrong dashboard. Preserve the selected UID in the report so a colleague can reconstruct that choice without relying on an ambiguous title.
Calculate the bounds before execution
- Keep the diagnostic interval at 30 minutes and request a 30-second step.
- Calculate requested points per series using floor(range / step) + 1.
- Inspect expression windows in the processed query before assuming its effective range fits one hour.
- Treat any rejection as a request to change the query inputs, preserving enforce mode.
For the illustrative diagnostic, 1,800 seconds divided by 30 seconds, plus one, gives 61 requested points per series. That is below the configured 121-point ceiling. This arithmetic describes the request budget, not a measured response size. Missing samples, multiple series and backend behavior mean the returned data need not contain exactly 61 values.
Effective range includes the request interval plus the longest range-vector or subquery window, with nested subquery ranges added. A 30-minute request with a five-minute expression window therefore measures 35 minutes under the documented rule, assuming no longer nested window. A panel’s actual expression may differ. Read processedQuery before applying this illustrative arithmetic.
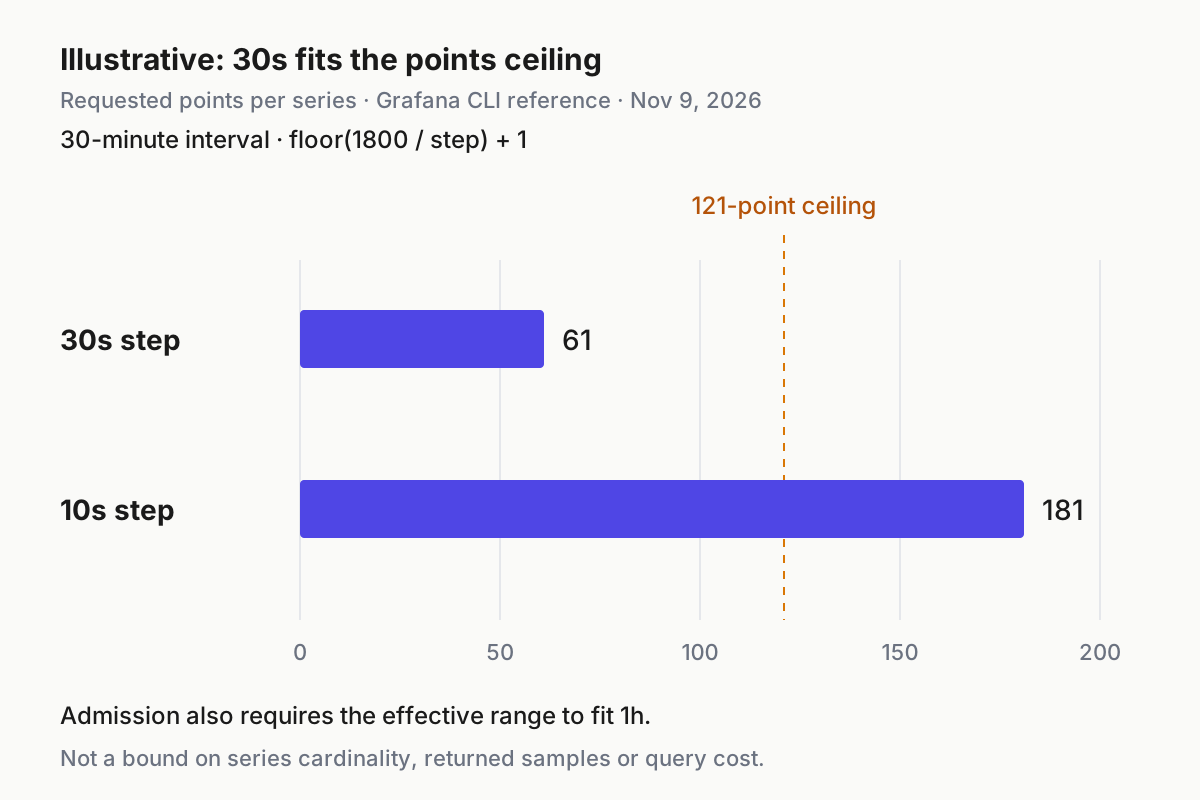
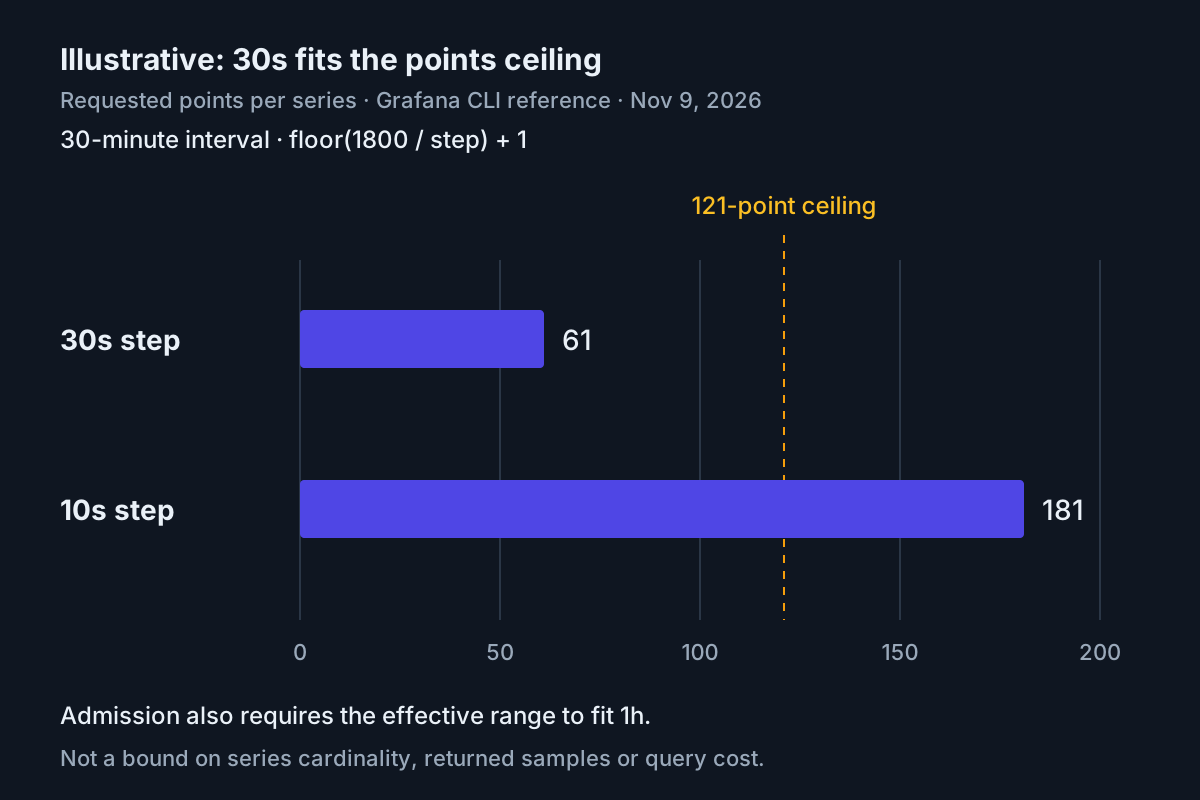
The points ceiling does not cap series cardinality, total samples, subquery evaluations or cost. Even an admitted short query can select many series. Keep the panel’s intended service selection and avoid broadening selectors merely to obtain some data. The range calculation also ignores offset and @; this is a documented guardrail limitation, not a complete bound on every aspect of backend work.
Grafana macros are substituted before expression measurement. If an expression still cannot be parsed, expression-window checks are unavailable and the request range and points checks remain. Admission therefore does not certify that every expression property was understood. Record unresolved variables and parsing warnings as uncertainty, and resolve them before interpreting the query as a faithful panel reproduction.
Resolution and duration solve different violations. For this example, reducing the requested step from thirty seconds to ten seconds raises the calculated request to 181 points per series, exceeding the configured ceiling. Returning to thirty seconds fixes that points violation. It would not fix an expression whose effective range exceeds one hour. For that rejection, shorten the requested interval or revise the diagnostic’s expression window deliberately, recording the changed meaning.
Run the same case and classify the result
- Execute the panel query with discovered identifiers and the recorded overrides.
- Preserve its result independently from the separate diagnostic query.
- Run the diagnostic with the same processed expression and datasource, requesting 30s resolution.
- Classify errors before retrying or changing any input.
The following populated table is the case worksheet. Every outcome is an illustrative expected observation, not an observed test result. Rows stay attached to the same investigation so a failed probe cannot quietly become a different query.
| Input | Action | Expected result |
|---|---|---|
| task:grafana-panel-01; Checkout API; service=checkout; 2026-11-08 14:00–14:30 UTC | Search, inspect and run the selected existing Prometheus panel using discovered dashboard UID and panel ID, explicit variables and absolute bounds | Illustrative: returned metadata identifies the intended panel and datasource; execution returns data or a specific Grafana error, independently of connection status |
| task:grafana-panel-01; same discovered datasource and resolved query; 1,800s interval; step 30s | Request query_prometheus as a range diagnostic through its advertised schema | Illustrative: 61 requested points per series fits the 121-point ceiling; effective expression range must also fit 1h before admission |
| task:grafana-panel-01; same resolved query; 2026-11-08 12:00–14:30 UTC; step 30s | Make one intentional over-range diagnostic request with enforce mode unchanged | Illustrative: the 2h30m request exceeds 1h even before expression windows; guardrail rejects it with rewrite guidance before datasource execution |
| task:grafana-panel-01; original 14:00–14:30 UTC interval; same datasource; explicit checkout selection | Restore the original bounded request after the rejection | Illustrative: the range violation is removed; permissions, expression windows and response limits still determine the next result |
The intentional rejection checks a specific boundary. Do not infer that it proves every expensive query is prevented. Record the exact rejection your installed build returns, then restore the original inputs. If the over-range request reaches the datasource, stop the exercise and inspect registration arguments and installed support before proceeding.
An empty result is different from a permission error. Preserve the empty response, verify the datasource and service selection, then check whether the absolute interval contains retained data. Do not report a healthy service merely because no series returned. If the service account lacks datasources:query, ask the administrator to correct the intended scoped permission; changing the PromQL cannot repair authorization.
Prometheus responses have a documented 10 MiB limit after decompression. Exceeding it produces an error rather than partial results. The supported recovery is fewer selected series, a shorter range or a larger step. Change one input at a time and label the resulting query as a revised diagnostic so it is not confused with the original panel reproduction.
When narrowing a response-size failure, preserve the original request alongside the revised one. A shorter interval can answer a narrower question, while selecting fewer series can exclude part of the service. Explain that consequence in the interpretation. A smaller successful response is useful evidence about the revised request; it does not retroactively supply the missing result for the original panel.
For transport-level failures, MCP Inspector diagnosis provides a separate connection investigation. Keep that distinction: registration, tool availability, authenticated dashboard reads and authenticated datasource execution are separate observations. The release notes specifically say HTTP initialize and tools/list no longer contact Grafana, making that separation especially important for network deployments.
Compare inputs in Grafana and write the report
- Open the intended dashboard in your authorized Grafana browser session.
- Set service to checkout and the same absolute UTC interval.
- Compare datasource identity and resolved query inputs before comparing values.
- If resolution differs, record that difference and compare only after the relevant query inputs agree.
- Finish with a report that separates tool output from interpretation and remaining uncertainty.
Do not compare two requests labelled last 30 minutes that ran at different times. Absolute bounds prevent that moving-window error. The official inspection guide explicitly recommends absolute bounds for separate-call comparisons. Also distinguish raw query results from the panel’s presentation: this tutorial establishes query equivalence, and the supplied evidence does not promise reproduction of every visualization transformation.
The diagnostic’s requested 30s step is deliberate, but the panel runner may use another effective step. Record what is exposed; do not declare numerical disagreement until the datasource, variables, processed expression, interval and relevant resolution match. A matching panel title is insufficient because different targets can use different datasource UIDs.
Compare the returned series labels as well as their values. If one result represents checkout and another includes several services, the inputs are not equivalent even when the plotted shapes resemble each other. If the browser shows data while the service-account query reports an error, report the credential-path difference first. Do not turn that disagreement into a claim that one query engine is calculating incorrectly.
Here is a fully populated illustrative report for a failed investigation. It demonstrates an honest usable result without inventing successful readings or production identifiers. Replace it with actual observations after your run; the fields named not captured are intentional limitations of this hypothetical case.
Investigation: task:grafana-panel-01
Status: incomplete — datasource authorization needs confirmation
Requested dashboard: Checkout API
Requested selection: service=checkout
Requested interval: 2026-11-08T14:00:00Z / 2026-11-08T14:30:00Z
Diagnostic resolution: 30s requested; 61 points per series calculated
Configured policy: enforce; max effective range 1h; max points 121

Observed data — illustrative hypothetical failure, not an actual run:
- MCP registration is listed.
- Dashboard search and inspection return a matching panel.
- Production UIDs and panel ID are not captured in this published example.
- Datasource execution returns a permission error; exact response not captured.
- No metric values or successful Grafana comparison are recorded.

Interpretation:
- Metadata access does not establish datasource-query authorization.
- There is no basis to conclude checkout is healthy or unhealthy.
- The 61-point arithmetic does not establish admission or successful execution.

Unknowns:
- Whether datasources:query is granted for the discovered datasource UID.
- Actual returned error wording and effective panel step.
- Whether the fixed interval contains retained checkout data.

Next action:
Ask the Grafana administrator to verify the service account's scoped
datasource-query permission. Preserve enforce mode. After correction,
repeat the original absolute interval and record actual identifiers,
processedQuery, query result and browser comparison before closing.
A successful report would instead contain actual returned identifiers, resolved inputs, interpretable data and a documented browser comparison. It should still retain unknowns where the tools do not expose a detail. Write a finish line the transcript can prove explains why a confident summary cannot replace those observations.
For a later unattended workflow, the standing observability brief addresses a different task: recurring channel output and operating boundaries. This tutorial ends with one interactive panel investigation. The broader AgentOps guide supplies the operating context without changing the permissions or claims of this setup.
Remove the registration or restore the previous setup
- End the investigation and remove the local registration with the documented command below.
- List registrations again and confirm that this investigation’s grafana entry is absent.
- If you replaced a prior registration, restore its preserved configuration through the documented add-json workflow.
- Start a new session before relying on the restored tool configuration.
claude mcp remove grafana
claude mcp list
# Expected: the removed local grafana registration is no longer listed.
Removal disconnects this local MCP registration; it does not revoke the Grafana service account token. Handle token retirement through your organization’s existing credential process if the token was temporary. Keep tokens out of the saved diagnostic report, and preserve only the configuration details needed to explain the investigation.
If startup fails because the binary is missing, Grafana’s client guide recommends checking which mcp-grafana and using the full binary path when necessary. If tools are missing, inspect the enabled categories and ensure --disable-query was not introduced. If queries are rejected, narrow their range, resolution or expression window as appropriate. Each recovery addresses its own failure instead of weakening unrelated controls.