You Can't Replay What You Can't See
An incident playbook for AI session replay: search supported session records together, inspect tool calls, match them to the diff, and resume where supported.

Go deeper. Build your own.
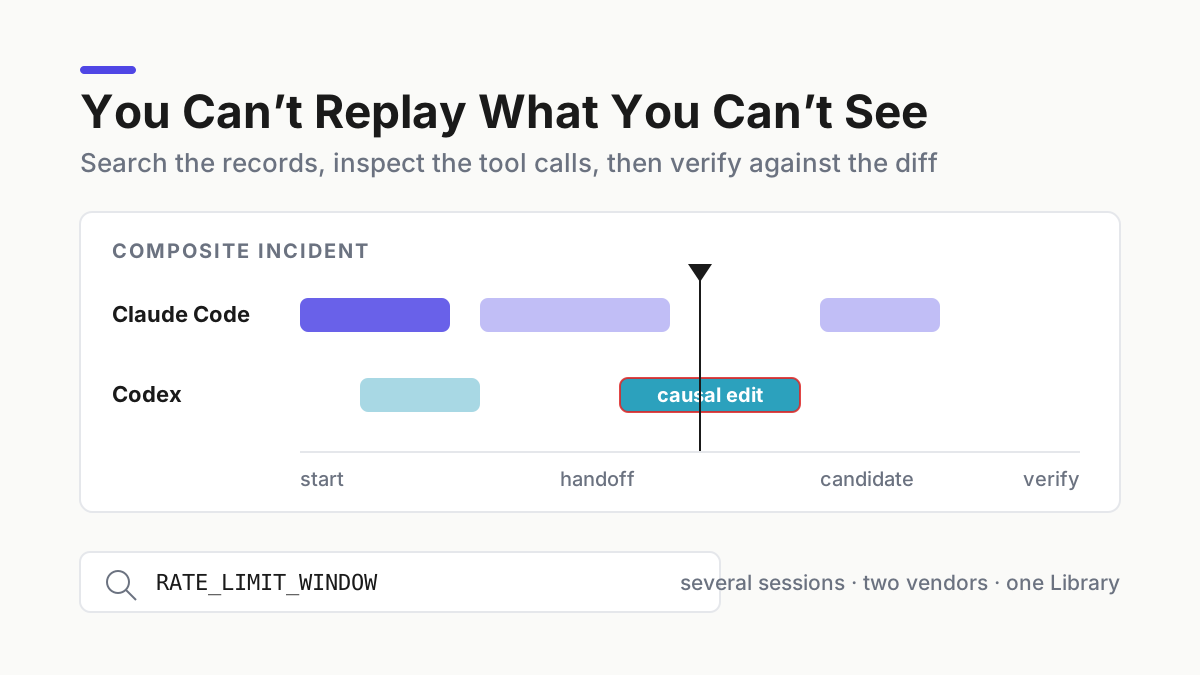
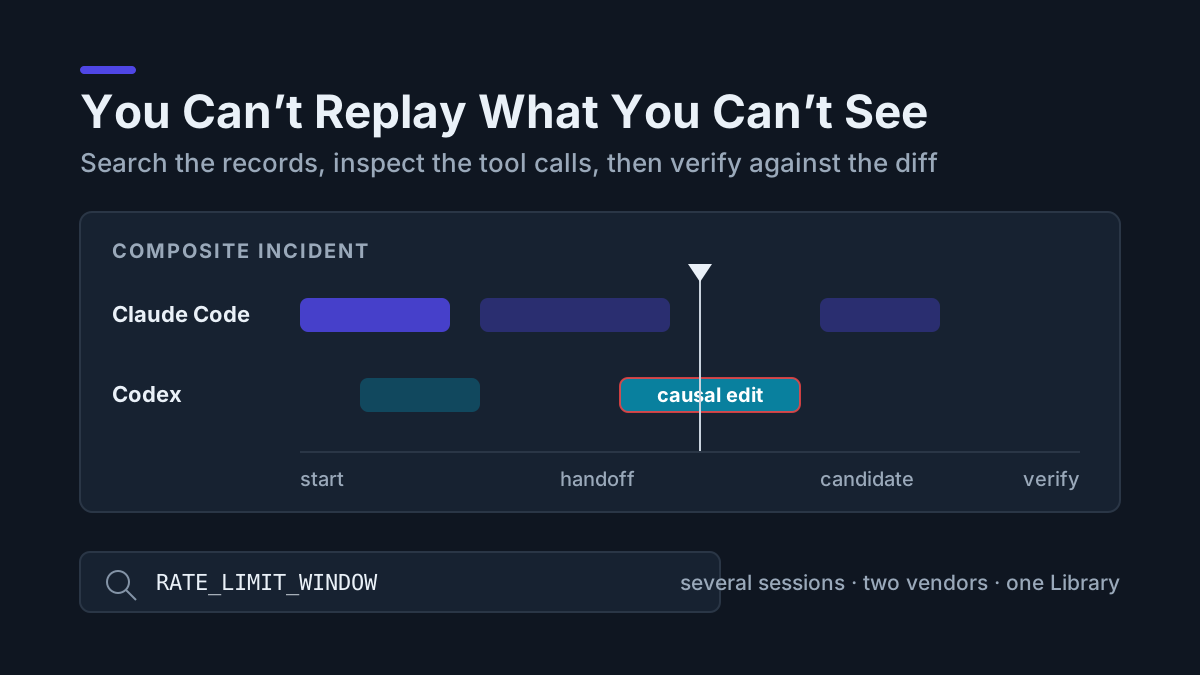
Consider a composite incident drawn from a common multi-agent failure shape. A PR renames RATE_LIMIT_WINDOW to RATELIMIT_WINDOW in one file out of four, and staging falls over on the next deploy. Claude Code planned the change and edited three files in a worktree; Codex ran the test pass and produced the final commit. The postmortem question is simple — which session wrote that line — but the evidence is scattered across two transcript stores.
That question is what AI session replay is for, and it is one of the least glamorous, most load-bearing parts of running a fleet. The stall-flags piece covered watching agents live; this is the other half — seeing what they actually did after the fact, across vendors, and returning to the relevant session when the harness supports it. Automater Lite’s local Library and the Session Explorer in Automater Desktop (the ADE, still in beta) are the product-shaped answer. The deliverable here is a repeatable incident playbook.
Why maka and agenttrail exist
Two open-source projects show different responses to the same evidence problem. Apache Maka is a local-first agent workspace whose append-only log records model messages, tool calls, results, permission decisions, and termination. Agenttrail is a local visual canvas for plans, tool calls, and file changes from Claude Code, Codex, and Cursor. Neither is proof that every vendor lacks an audit surface, and they are not interchangeable replay products. Their shared premise is narrower and useful: session evidence should be inspectable outside the assistant that produced it.
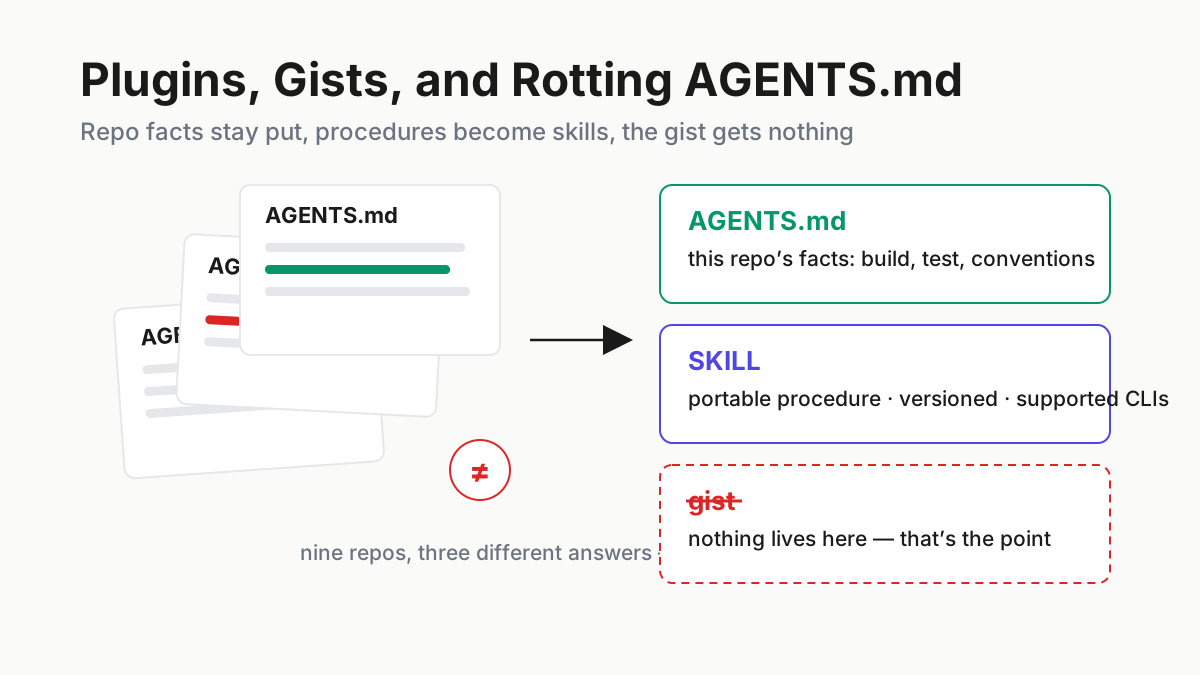
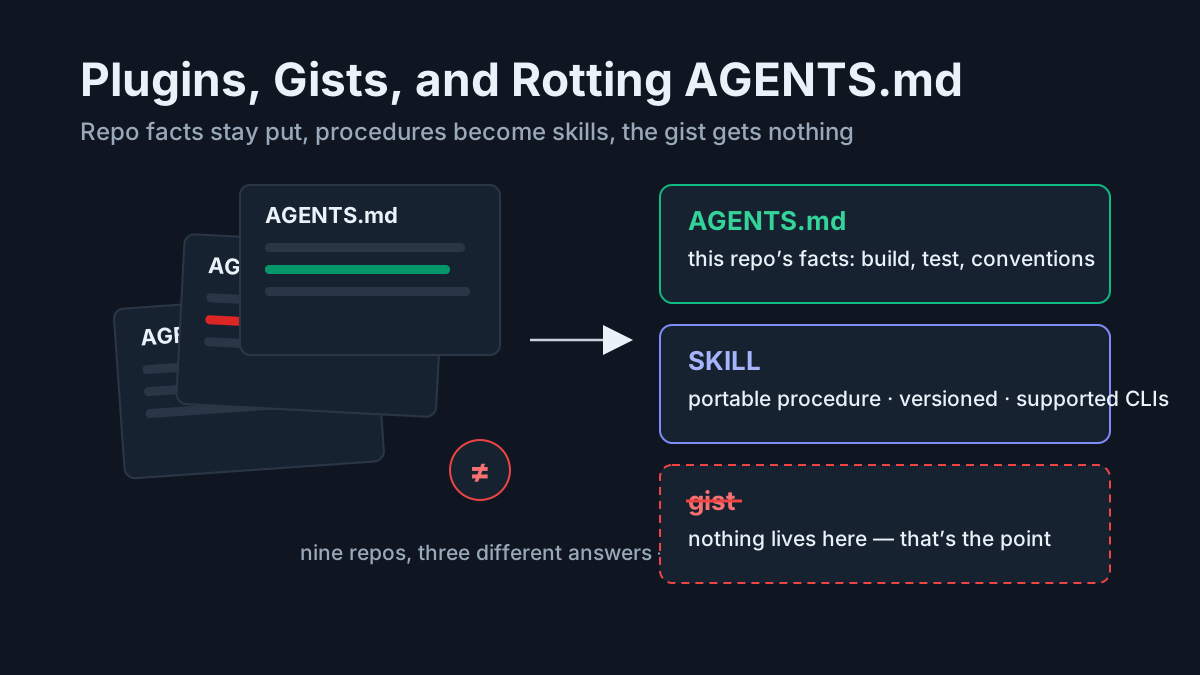
Claude Code’s session picker handles Claude Code sessions. Other CLIs maintain their own formats and locations. Cross-vendor reconstruction therefore needs either a unifying archive or careful manual correlation.
The agentic-ops stack calls this layer one — tracing and observability — and at team scale you buy it. At desk scale nobody sells it, because no vendor has an incentive to index its competitors’ sessions. The only party with that incentive is you.
What AI session replay looks like when it’s local
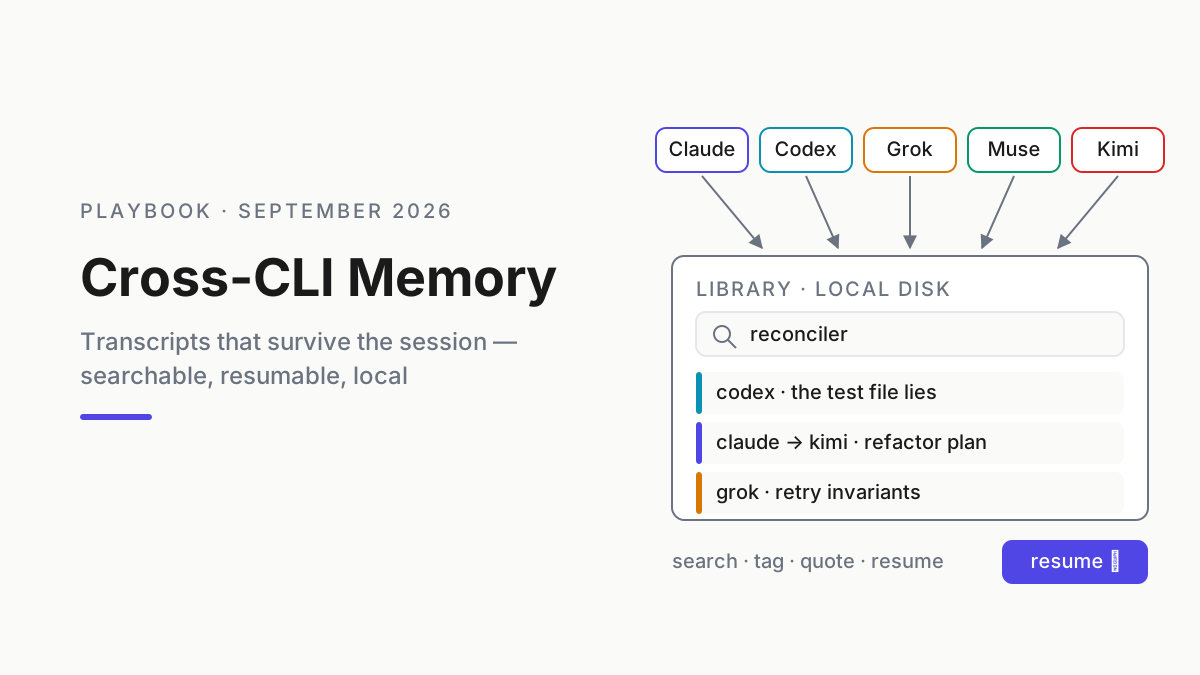
The product behavior, concretely. The Library in Automater Lite consolidates supported session records from recognized assistants on the machine. Adapter coverage and each tool’s export path define the boundary. Four verbs matter for replay:
- Import. Supported session records land in one local archive instead of staying scattered across vendor directories. Automater’s archive stays local by default; the provider CLIs may still use their own network services while they run.
- Tag.
incident-0825,pr-1482,exonerated. Tags are how a pile of transcripts becomes a case file. - Search. Full-text, across transcript content, across vendors. This is the verb the vendors cannot give you.
- Resume. Reopen a supported session in its original CLI and continue from its saved conversation. Continuation is useful for repair, but it is not deterministic replay: files, services, dependencies, and credentials may have changed since the transcript was written.
Two habits make the verbs pay off, and they cost minutes a week. Import routinely, not forensically — the worst time to build an archive is the Thursday you need one, so sessions get pulled in as they finish, not after an incident. And tag at write time, while you still remember what a session was for; pr-1482 applied on Tuesday is worth ten minutes of Thursday reconstruction. None of this requires changing how any agent runs. The CLIs keep writing what they already write; the Library just refuses to let it stay scattered.
Reading the Library is free in Lite. The bigger sibling is the Session Explorer in Automater Desktop — the ADE, in beta — which maps every Claude, Codex, and Gemini session on the machine alongside the live topology of hosts, WSL runtimes, and Docker Compose stacks. When an incident spans a container and two runtimes, that view is the difference between a story and a map, though new installs are on hold: “Desktop downloads are paused for new installs while we finish a review.” Everything below works in the free tray app.
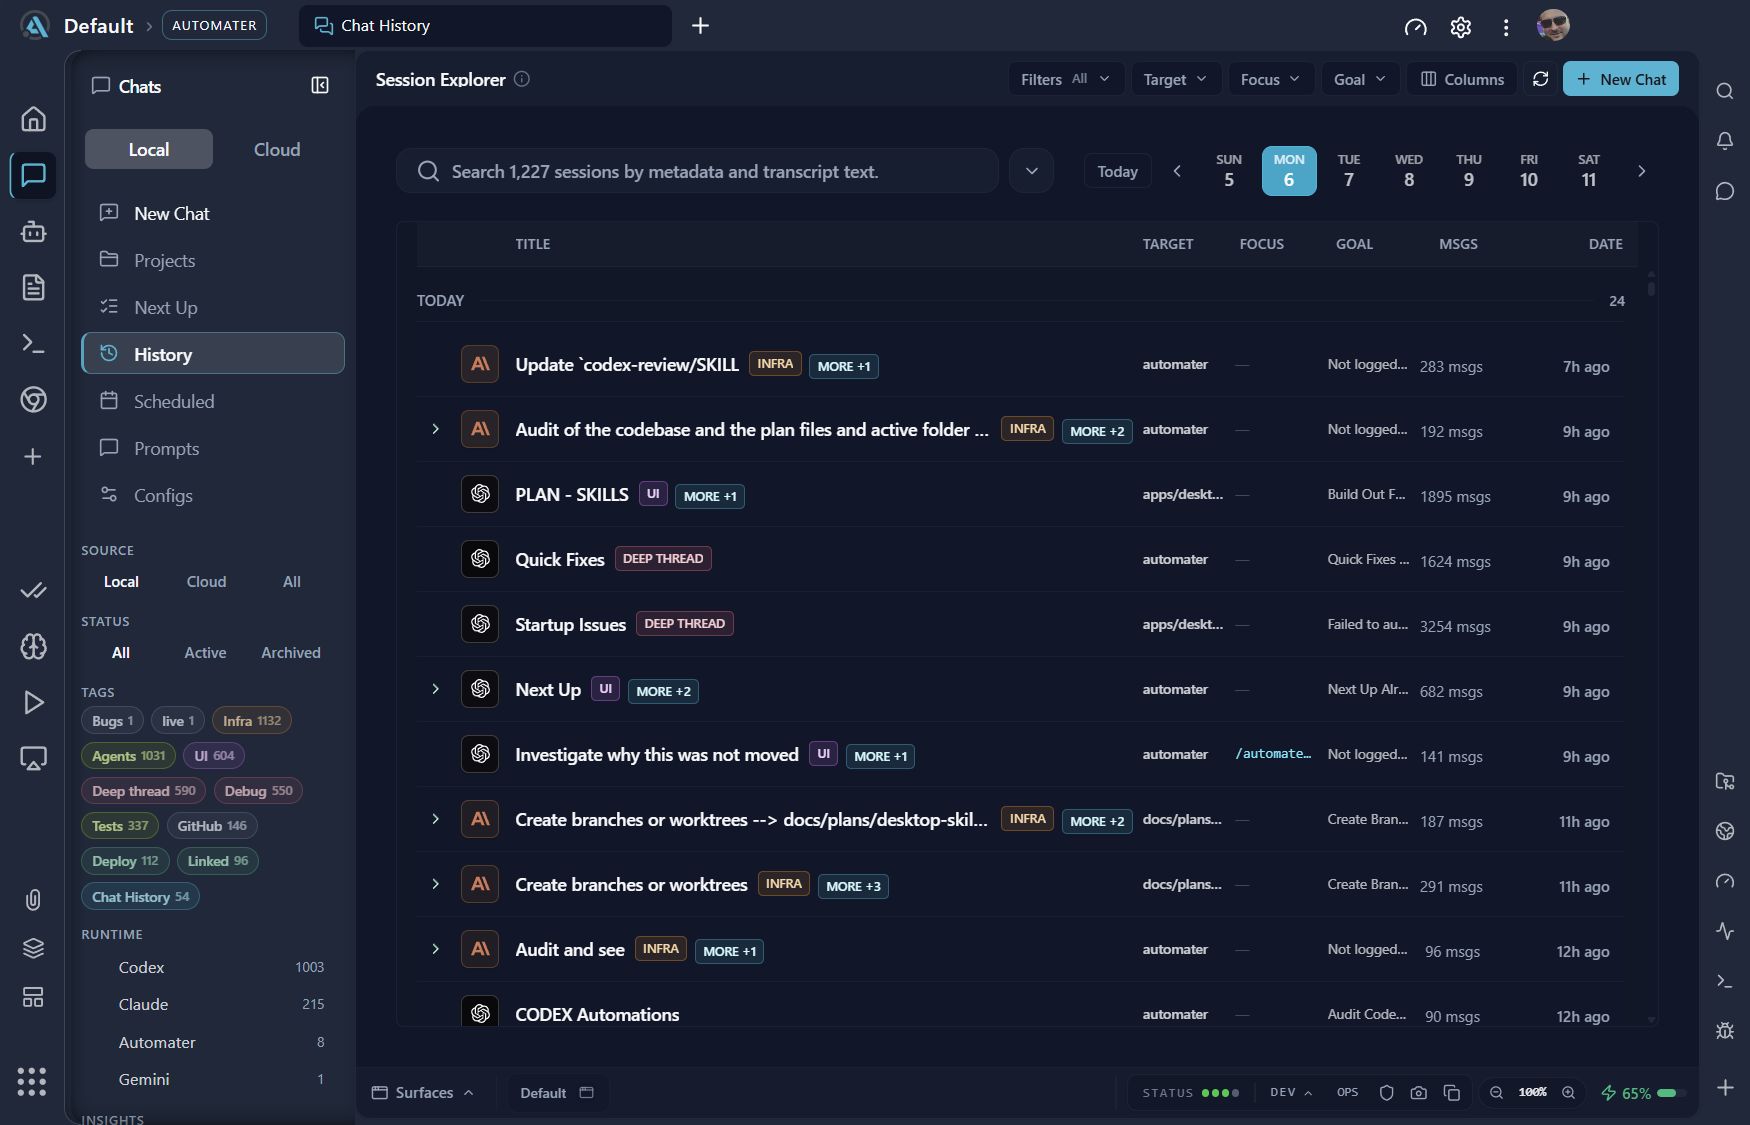
The incident playbook: replay agent sessions after a bad PR
Scenario, restated as a runbook target: a bad change shipped Tuesday; the work spanned Claude Code and Codex; you need the actual trace, assign the cause, and fix it — ideally in the session that caused it.
Step 1: Find the sessions — search the Library, not six dot-directories
The old way is archaeology. Current Claude Code docs put local JSONL transcripts under ~/.claude/projects/<project>/, while Codex rollouts commonly appear under ~/.codex/sessions/; layouts and retention can change with releases:
# the old way, before the Library — one grep per vendor, per format
rg -l "RATELIMIT_WINDOW" "$env:USERPROFILE\.claude\projects\"
rg -l "RATELIMIT_WINDOW" "$env:USERPROFILE\.codex\sessions\"
# ...and four more of these, with four more path conventions
That finds files, not sessions, and it finds them one vendor at a time. In the unified-archive version of the playbook, search RATELIMIT_WINDOW once. Suppose the result is four sessions — two Claude Code, two Codex — within the PR’s active window. Tag those records with the incident ID before the investigation branches again.
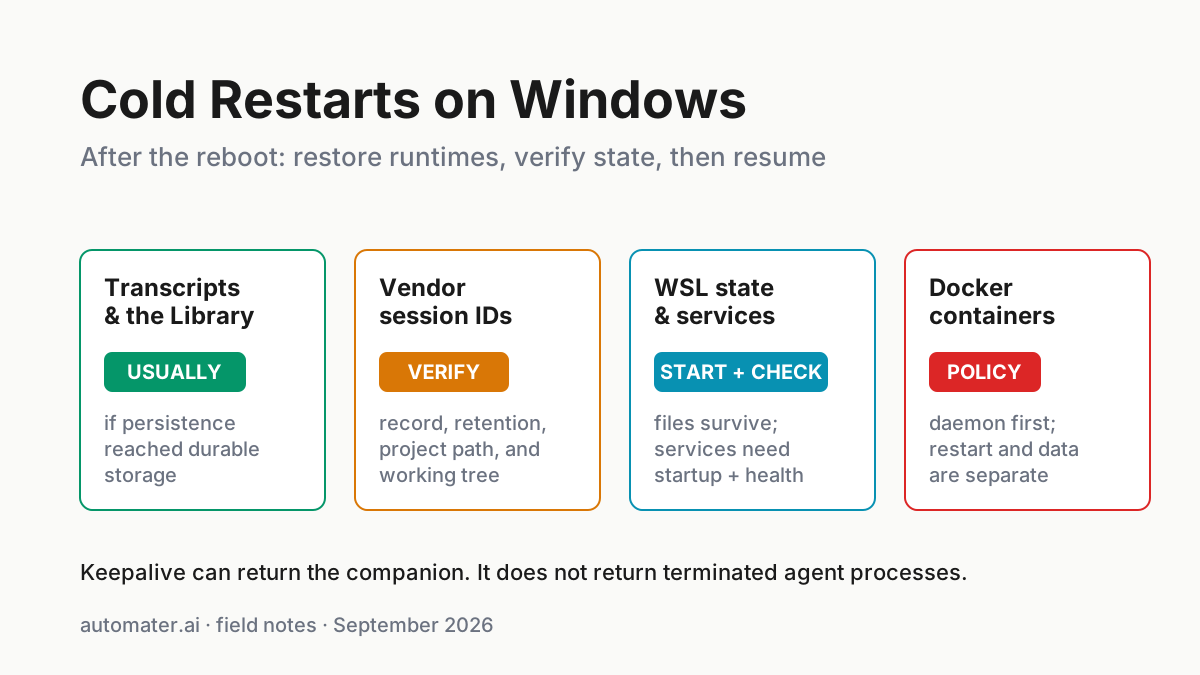
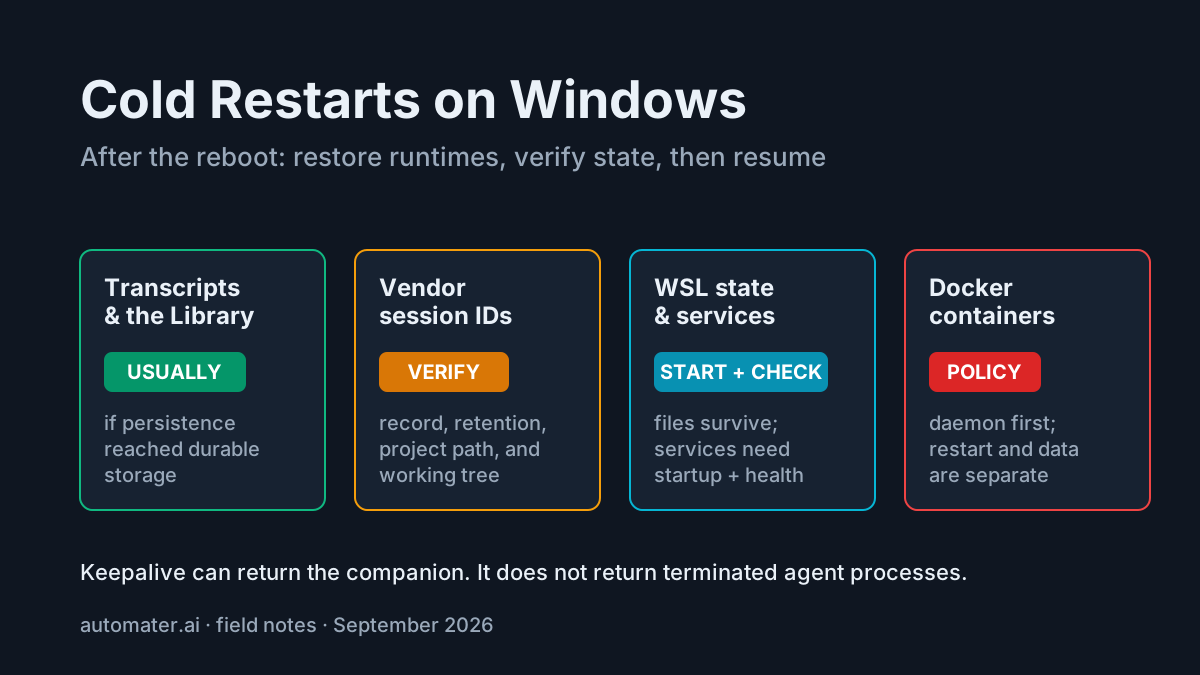
One honest note on coverage: the Library replays what was written. A tool that produces no transcript produces no replay, and a session that never got archived before a machine died is gone — which is half the argument in the cold-restarts piece for archiving as a habit rather than a rescue.
Step 2: Read the actual tool calls, not the story
Inside each session, ignore the prose and read the tool log: the file edits with their diffs, the commands with their exit codes, the fetches with their URLs. This is the agent audit trail — what the process did, recorded as it did it. For the Thursday question, three kinds of entries carried all the weight: every edit that touched a config file (with the before and after text), every git command with its exit code, and every test run with its failure output — because the failure output is usually what provoked the next edit.
It is not the same thing as what the agent said it did. End-of-run summaries are generated interpretations, and an auto-generated architecture diagram is not an audit record. In this composite case, imagine the summary says “normalized rate-limit configuration naming.” The edit log instead shows a rename applied in three files and reverted in two after a failing check, with the third file forgotten. The story says cleanup; the trail says incomplete rollback.
Step 3: Correlate with the diff
Now put the PR diff next to the transcripts and walk hunks against edits. Two questions per hunk: which session produced this line, and what was the agent doing at that timestamp. Commit times from git log line up against transcript timestamps well enough to order events across vendors — that ordering is the thing no single vendor’s UI could have shown.
One caution from doing this more than once: treat cross-vendor timestamps as a partial order, not a stopwatch. Formats disagree about timezones, some record the start of a tool call and some the end, and a two-second discrepancy will send you down the wrong branch of the story. Anchor on the git history — commits are the fixed points — and hang transcript events off those anchors rather than comparing raw clock readings between vendors.
The composite trail now supports a finding rather than a hunch. Claude Code initiated the rename, but its check caught the inconsistency and its final state was correct. A later Codex test-fix pass changed the fourth reference to match stale state, and that commit shipped. Cross-vendor reconstruction identifies the causal edit and avoids blaming the first session merely because it touched the symbol first.
Step 4: Resume or annotate
Close the loop in one of two ways. Resume the relevant session in its original CLI, verify the checkout and runtime state, then provide the failing evidence and ask for a fix-forward plan. The saved conversation preserves prior reasoning; it does not preserve the old filesystem. Or annotate: tag the causal session, record the finding, and leave a compact case file for the postmortem. On the current Automater product page, Lite includes local Library reading, search, and resume; PRO adds advanced messaging, inline replies, and built-in terminal/repository/file browsing.
Automater Lite is a free download for Windows, macOS and Linux at automater.ai/downloads.
Time the exercise in your environment and keep the result as a baseline. The meaningful measure is not how fast a demo finds a string; it is how long an operator takes to move from an incident symptom to a defensible causal sequence.
Diagnostics, not observability
Let me say this directly, because the category matters: this is not a new observability vendor. There is no agent SDK to install, no spans to export, no hosted dashboard, no per-trace pricing. The Library is diagnostics — a flight recorder and a search box for the fleet on one machine, built out of the transcripts your tools already write. If the word “replay” makes you budget for another vendor relationship, the entire pitch here is that at desk scale you do not need one; you need the artifacts you already have, made searchable in one place, on your own disk.
Honest scope: fleet replay, not distributed tracing
The boundary, stated plainly. This is personal and fleet scale — one operator, one machine, several assistants. It is not distributed tracing. If your agents run in production behind services, you still need real telemetry — OpenTelemetry pipelines, retention policies, and the SIEM your security team already runs. A local library does not replace any of that.
A second boundary lives inside the transcripts themselves: the trail records what the agent did through its harness. The command it ran, yes; the thing a wedged remote service did with that command, no. What a human typed into a terminal between agent turns, no. If an incident’s cause sits outside the transcript — a hotfix, a flaky dependency, a deploy pipeline doing deploy-pipeline things — reconstruction may clear the agents without identifying the root cause. The Library answers “what did the recorded agents do on this machine”; the moment the question becomes “what happened across our infrastructure,” you are in layer-one territory with production telemetry requirements.
The unacceptable gap is the desk with six dot-directories and no answer to a simple question about last week’s work. An agent fleet you cannot replay is a fleet you are taking on faith.
FAQ: AI session replay
What is AI session replay?
AI session replay is reading a stored agent session after the fact — the prompts, tool calls, file edits, and outputs, in order — to reconstruct what an agent actually did. At fleet scale it means one searchable archive across every vendor’s transcripts, not one viewer per CLI.
How do I replay agent sessions across different CLIs?
When a CLI exposes a durable local record, it uses its own path and format. Cross-vendor reconstruction therefore needs supported imports into one local library, one search, and timestamps. Automater Lite does this for recognized records; cloud-only and unsupported histories require explicit exports or remain documented gaps.
Is session replay the same as an agent audit trail?
They are the same artifact used two ways. The audit trail is the record — tool calls, edits, commands with timestamps. Replay is the act of walking that record to answer a question. A trail you never replay is dead weight; replay without a trustworthy trail is guesswork.
Sources
- Automater — the Library in Automater Lite; Session Explorer in Automater Desktop (beta)
- Apache Maka — append-only event logging in a local-first agent workspace
- Agenttrail — local visual inspection of supported coding-agent activity
- Claude Code session docs — transcript location, retention, and resume semantics
- Backpass — current cross-harness transcript locations used by its local readers
- OpenTelemetry observability primer — the production observability lane this playbook does not replace